
Premier Anomaly: A Framework for Beating SPY Year After Year
Beating SPY was supposed to be impossible. We did it anyway.


In the summer of 1831, a massive volcanic eruption released sulfur gas into the atmosphere, scattering sunlight and giving the sun unusual green, purple, and blue hues. The diminished sunlight caused global temperatures in the Northern Hemisphere to drop by 1°C, leading to widespread crop failures and famine.
During this period, German composer Felix Mendelssohn, traveling through the Alps, observed the chilling effects firsthand. Writing in his journal, he noted, “it is as cold as in winter, there is already deep snow on the nearest hills” (Wizevich, 2025).
Forecasting the stock market is like forecasting the weather—both rely on historical data, trends, and shifting variables. While neither can offer certainty, they provide ranges of probable outcomes within their unpredictability. Snow in the summer can be quite rare depending on the geography.
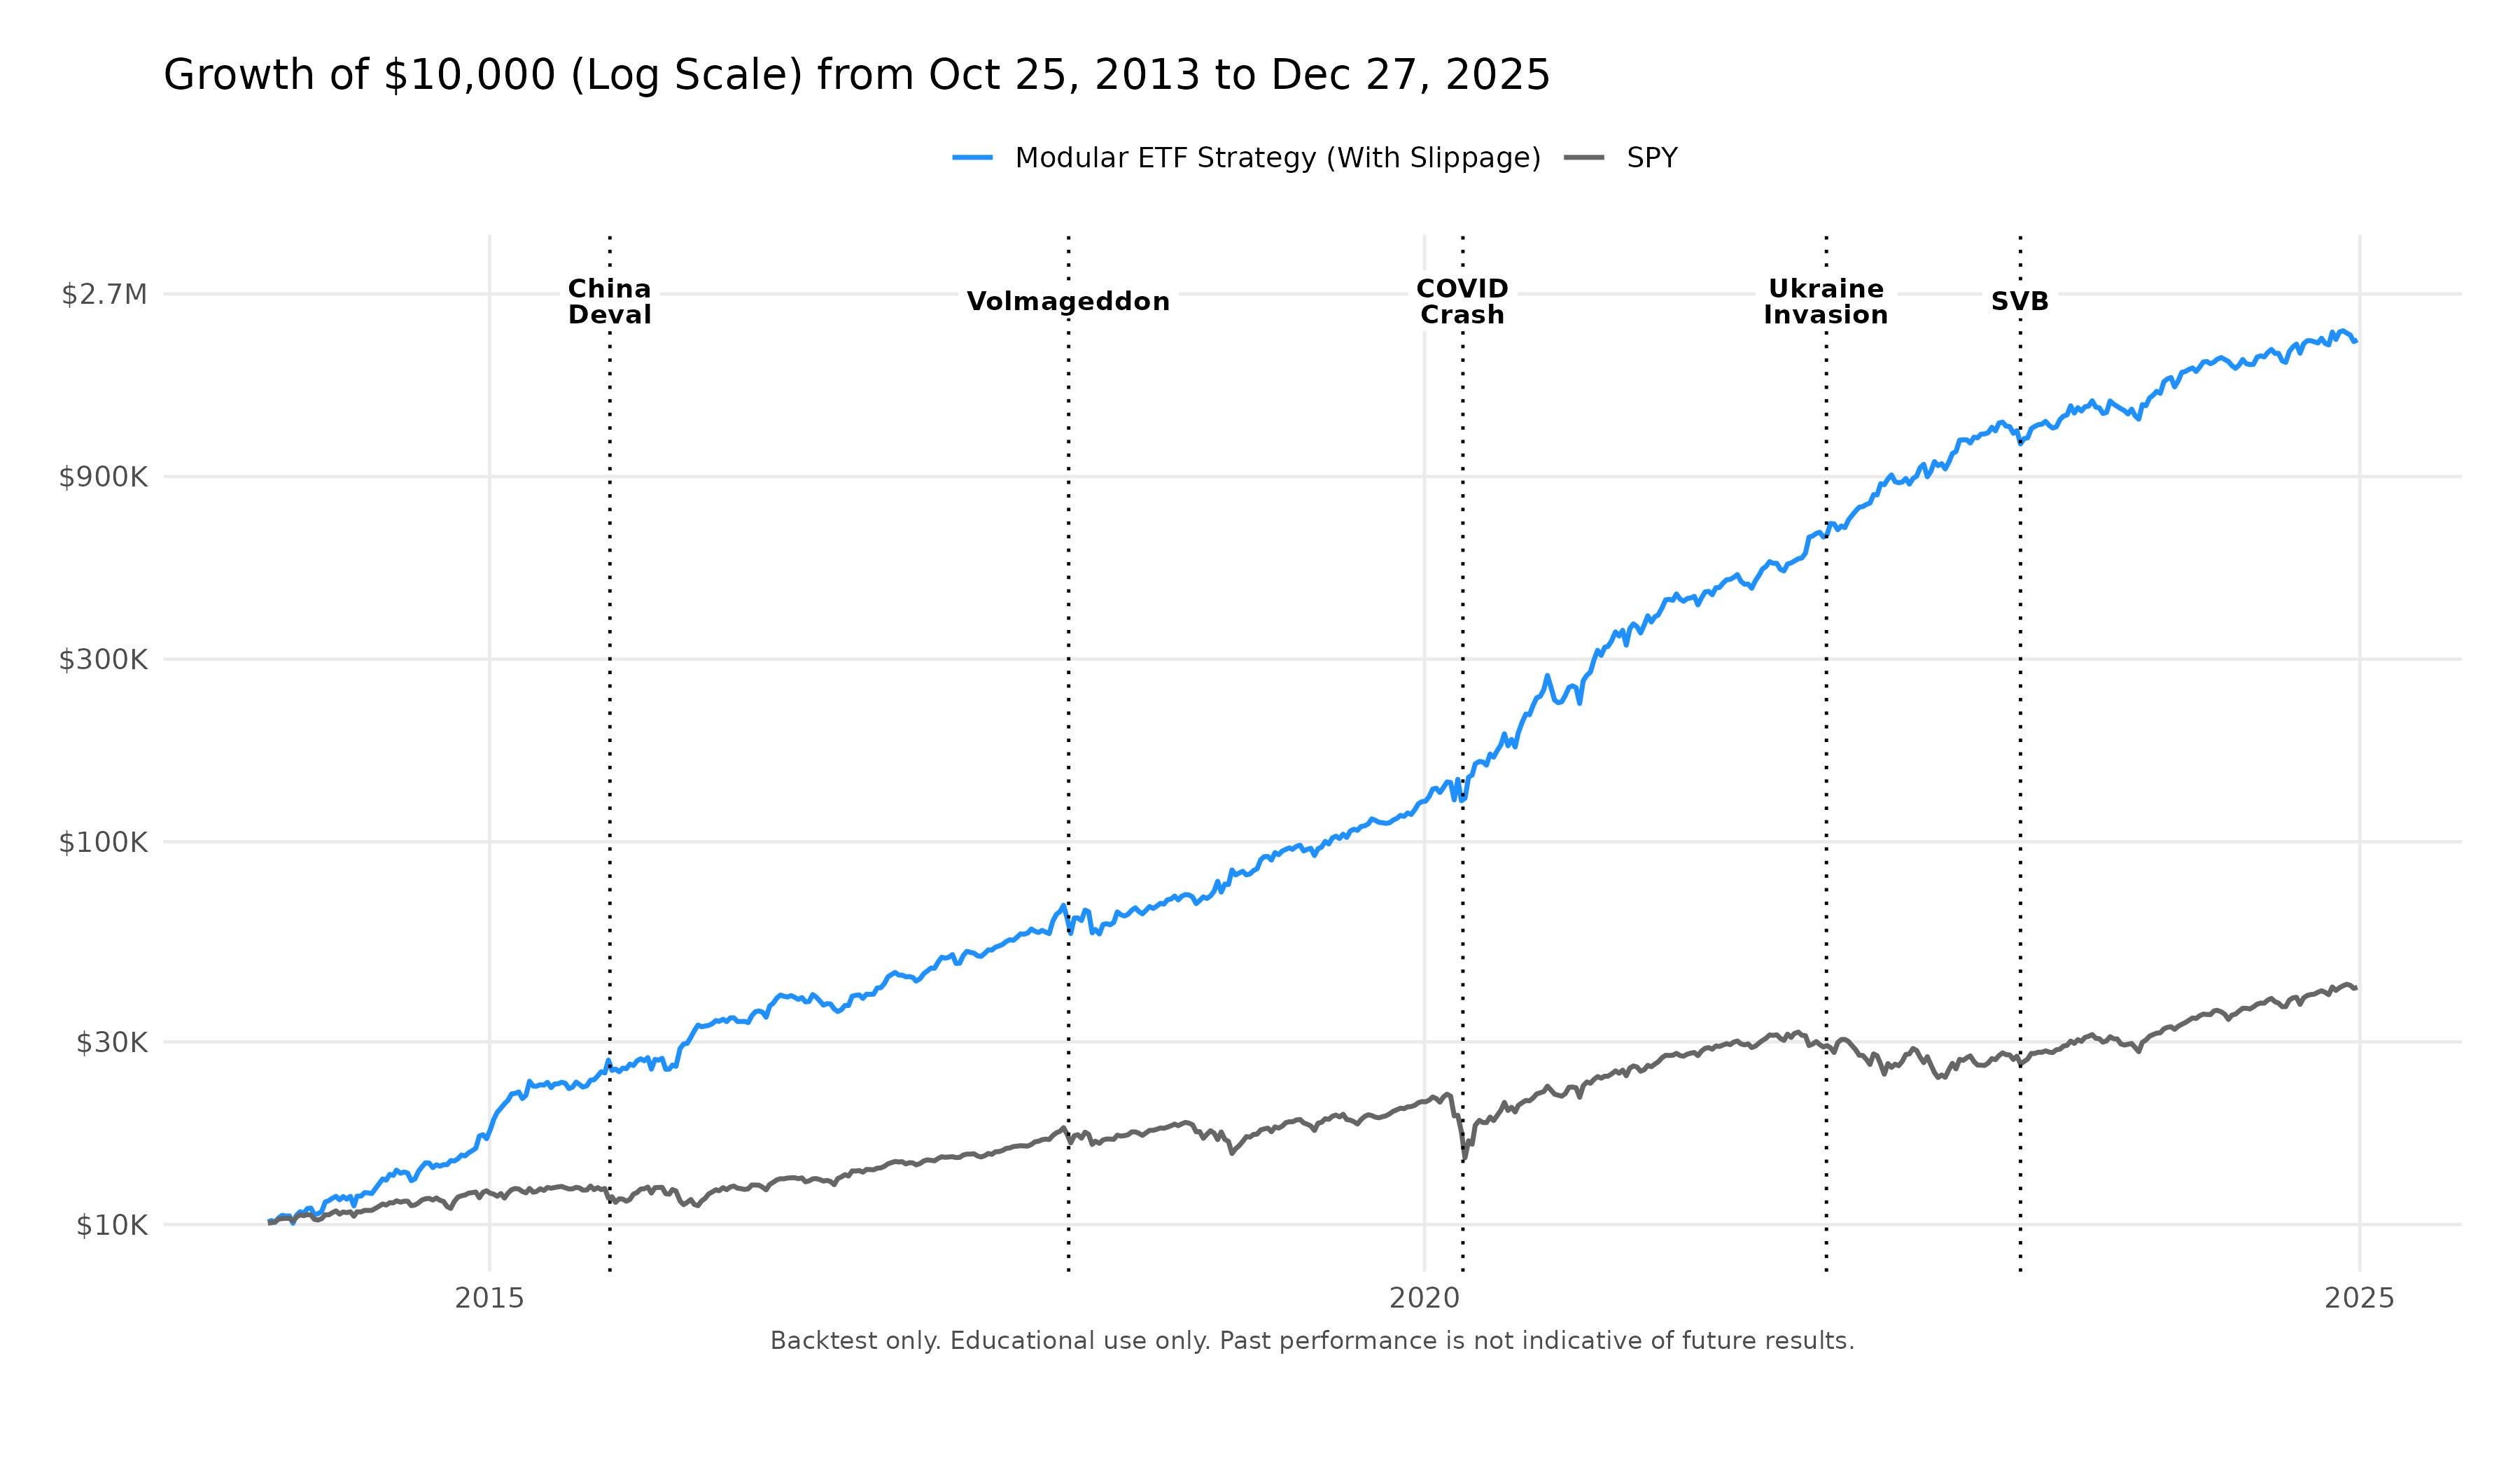
The Stratum Modular ETF Strategy embodies disciplined adaptability—balancing risk and reward by preparing for the unexpected. In backtests since 2013, the Stratum Modular ETF Strategy has shown how a $10K investment could have grown to over $2.05 million (a 20,492% total return) while sidestepping major drawdowns such as Volmageddon, the COVID crash, and the SVB collapse.
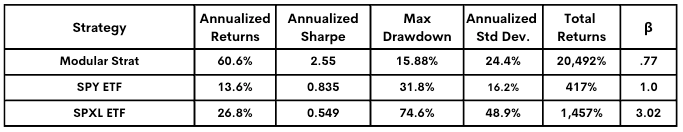
After estimated slippage and fees, the strategy’s 60.6% annualized return and 2.55 Sharpe ratio far exceed benchmarks such as SPY (13.6%, 0.835 Sharpe) and SPXL (26.8%, 0.549 Sharpe). By diversifying across ETFs and adapting dynamically to market shifts, it captures growth efficiently while maintaining lower volatility and smaller drawdowns than traditional equity benchmarks.
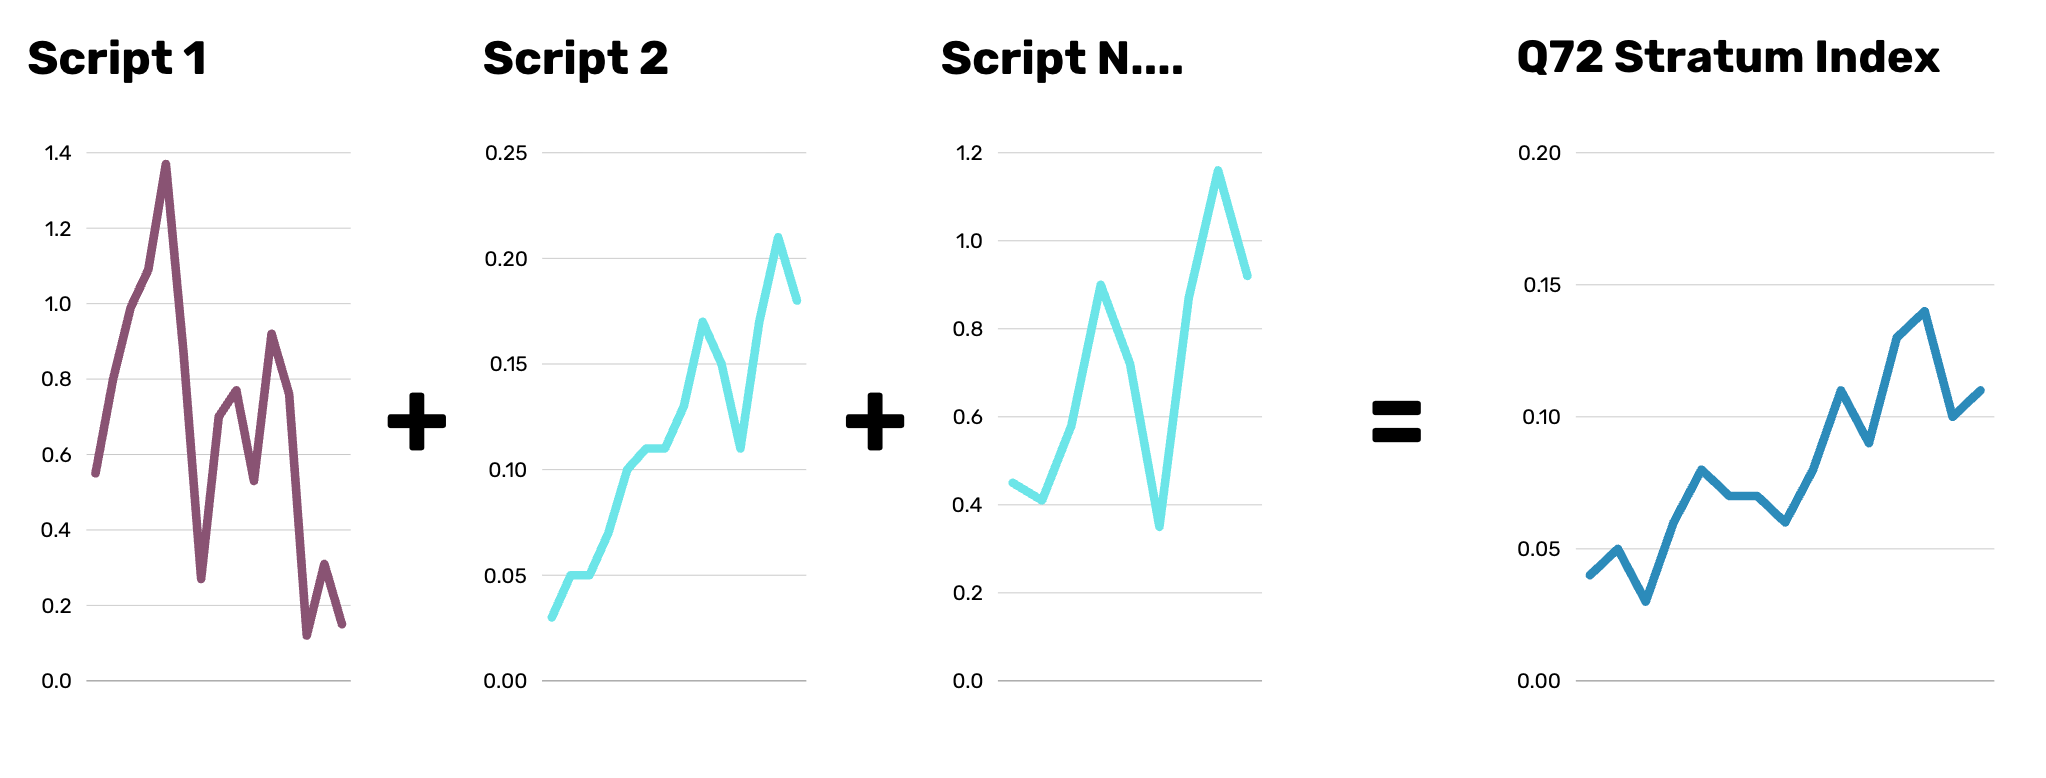
Modular ETF Strategy
For research and educational use only. Not investment advice. Past performance is not indicative of future results.
Out of Sample Results
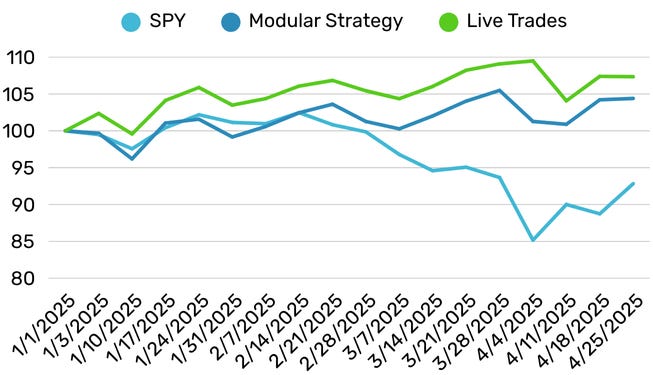
The early 2025 period offered a valuable live test of the Modular Strategy’s discipline. As markets weakened through March, SPY fell, in contrast, Q72’s Live Trades climbed, a striking divergence that underscored the model’s defensive rotation and adaptive posture.
By shifting toward Treasuries and gold during this phase, the system avoided the worst of the volatility and preserved gains. This live performance provided a reassuring confirmation that the model’s protective mechanisms function as designed under real market stress.
Live Validation: Modular Strategy Avoids Early-2025 Drawdown
Disclaimer: Results may include real trades from my personal account guided by the Stratum Algorithm but executed at my discretion. Differences in execution timing, transaction costs, and position sizing can lead to performance variations. Modeled results are derived from historical simulations. All content is provided for educational and research purposes only, not financial advice. Past performance is not indicative of future results.
A Modular Approach to the Momentum Strategy Design
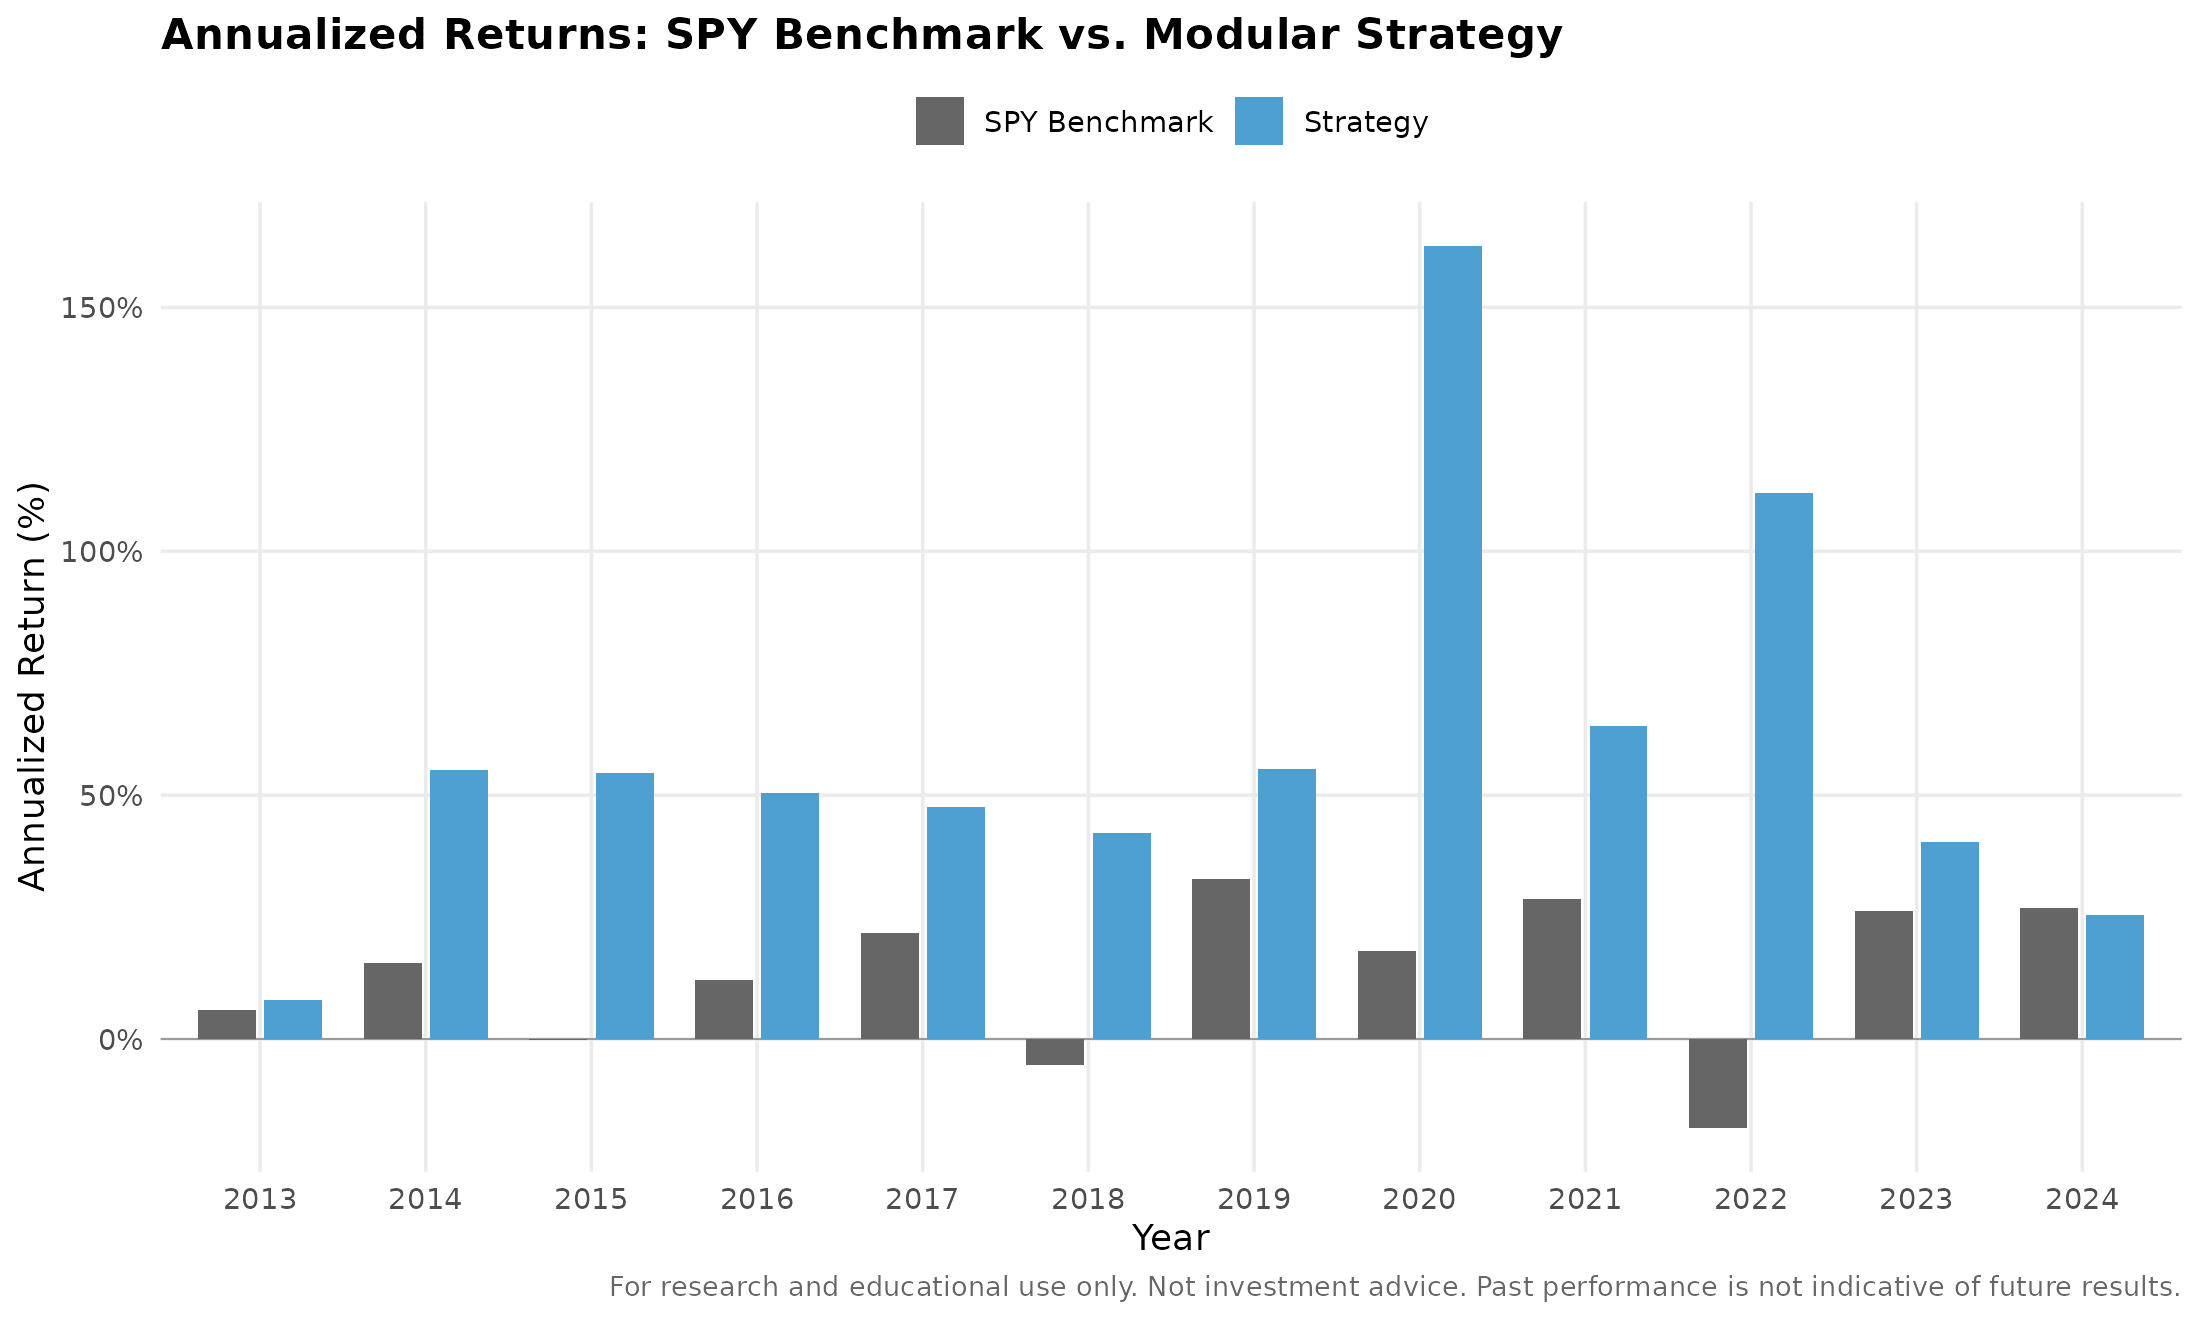
The Stratum Modular ETF strategy is a systematic, rules-based approach that trades weekly. Using a modular framework where multiple algorithms independently select ETFs, it reduces overfitting, hindsight bias, and trading costs. This results in a diversified portfolio with lower risk and superior risk-adjusted returns. Over 11 years, the Stratum Modular ETF strategy would have returned 204.9x the initial value, compared to just 4.17x for a simple buy-and-hold SPY investor.
Stratum Modular ETF Strategy (Oct 25, 2013 – Dec 27, 2024
Algorithmic Trading Challenges

Financial markets, shaped by human behavior, are prone to recurring follies. For centuries, crashes have stemmed from speculative bubbles, fueled by overconfidence and flawed assumptions.
A cautionary parallel is the South Sea Bubble of 1720, where rampant speculation led to a catastrophic market collapse. Sir Isaac Newton—brilliant mathematician and inventor of derivative calculus—fell prey to the frenzy, losing £20,000 after reinvesting at the bubble’s peak. Adjusted for inflation, his loss would amount to millions today.
His reflection, "I can calculate the motions of the heavenly bodies, but not the madness of men," underscores the enduring challenge of predicting market behavior. Just as Newton misjudged the power of speculation, modern trading—no matter how sophisticated—often fails to anticipate herd mentality, abrupt shifts, and the deep irrationality that still governs financial markets.
"I can calculate the motions of the heavenly bodies, but not the madness of men.” - Sir Isaac Newton
Data Mining Challenges
Efforts to time financial markets and identify price trends have long divided practitioners and academics, with the debate hinging on whether patterns in past data can truly predict future outcomes. Before the 2000s, most academics dismissed market timing as futile, exemplified by Malkiel's (1995) critique of technical analysis, which argued that such methods added little value beyond randomness.
However, Brock et al. (1992) shifted perspectives by applying 26 technical trading rules to the Dow Jones Industrial Average (DJIA) from 1897 to 1986. Their robust methodology accounted for data-snooping bias, used a long historical dataset, and demonstrated potential support for technical strategies. Yet, follow-up studies like Fang, Jacobsen, and Qin (2013) found poor out-of-sample performance for these same rules, raising questions about their reliability.
The challenges of data mining came into sharper focus with Bajgrowicz and Scaillet’s (2012) monumental effort to evaluate 7,846 trading rules on the DJIA from 1897 to 2011. Using the false discovery rate (FDR) to correct for data-snooping bias, they showed that investors could not have identified the best-performing rules in advance. Introducing transaction costs eliminated any remaining profitability.
Similarly, Fang, Qin, and Jacobsen (2014) tested 93 market indicators on S&P 500 data and found that none outperformed a simple buy-and-hold strategy after accounting for costs. These findings underscore the inherent challenges of data mining, where the search for meaningful patterns often leads to overfitting or chasing noise disguised as signal. Such outcomes reinforce the value of simple, robust strategies like absolute momentum, as highlighted by Antonacci (2014, pp. 131–132), which prioritize enduring principles over fleeting statistical curiosities.

Momentum: The Premier Anomaly
Stock movements reflect patterns shaped by investor behavior and fundamentals. The S&P 500 selects the top 500 U.S. companies by market cap, favoring firms with sustained growth. Recurring deposits from retirement accounts into these stocks further amplify returns, creating reliable yet semi-predictable growth trends. These contributions are intentional, not random, driving capital into these companies.
This highlights the market's semi-random nature, where factors like earnings, industry performance, and geopolitical events create impacts that are semi-predictable yet inconsistent. News—a subjective force—might drive sharp movement in a stock one week and have no effect the next.
Amid this, the momentum effect stands out as one of the most robust and widely studied phenomena in financial markets, with evidence spanning various asset classes and historical periods. Research, including the foundational work of Jegadeesh and Titman (1993, 2001), has validated the predictive power of momentum, both in relative strength—where an asset's performance relative to its peers predicts its future performance—and in absolute momentum, where an asset's own past returns forecast its future performance.
Absolute momentum, which measures an asset's excess return over a specific look-back period, has shown strong applicability across asset classes such as commodities, equity indices, bond markets, and currency pairs, even back to the early 1800s (Geczy and Samonov, 2012; Hurst, Ooi, and Pedersen, 2012; Antonacci, 2014).
Profiting from the ‘Madness of Men’
Momentum investing thrives on the "madness of men," despite ongoing debates about its underlying causes. Behavioral explanations, such as anchoring, herding, and the disposition effect, suggest that cognitive biases fuel momentum profits. These biases lead investors to underreact to new information, overreact during trends, and mishandle winning and losing investments. Additionally, risk-sharing mechanisms and structural market dynamics, as highlighted by Brown and Jennings (1989) and Zhou and Zhu (2014), offer further insights into the persistence of momentum, blending human psychology with market mechanics (Antonacci, 2014, pp. 153–154).
Modular Script Architecture
The Stratum Modular ETF strategy consists of multiple algorithms that measure relative and absolute momentum across varying timeframes. Script 1 might allocate 10% to an equities ETF, while Script 2 might allocate 10% to a defensive ETF, and so on. The final strategy combines the outputs of all the scripts, resulting in a balanced and diversified portfolio.
Example Allocation for the Modular ETF strategy
Methodology
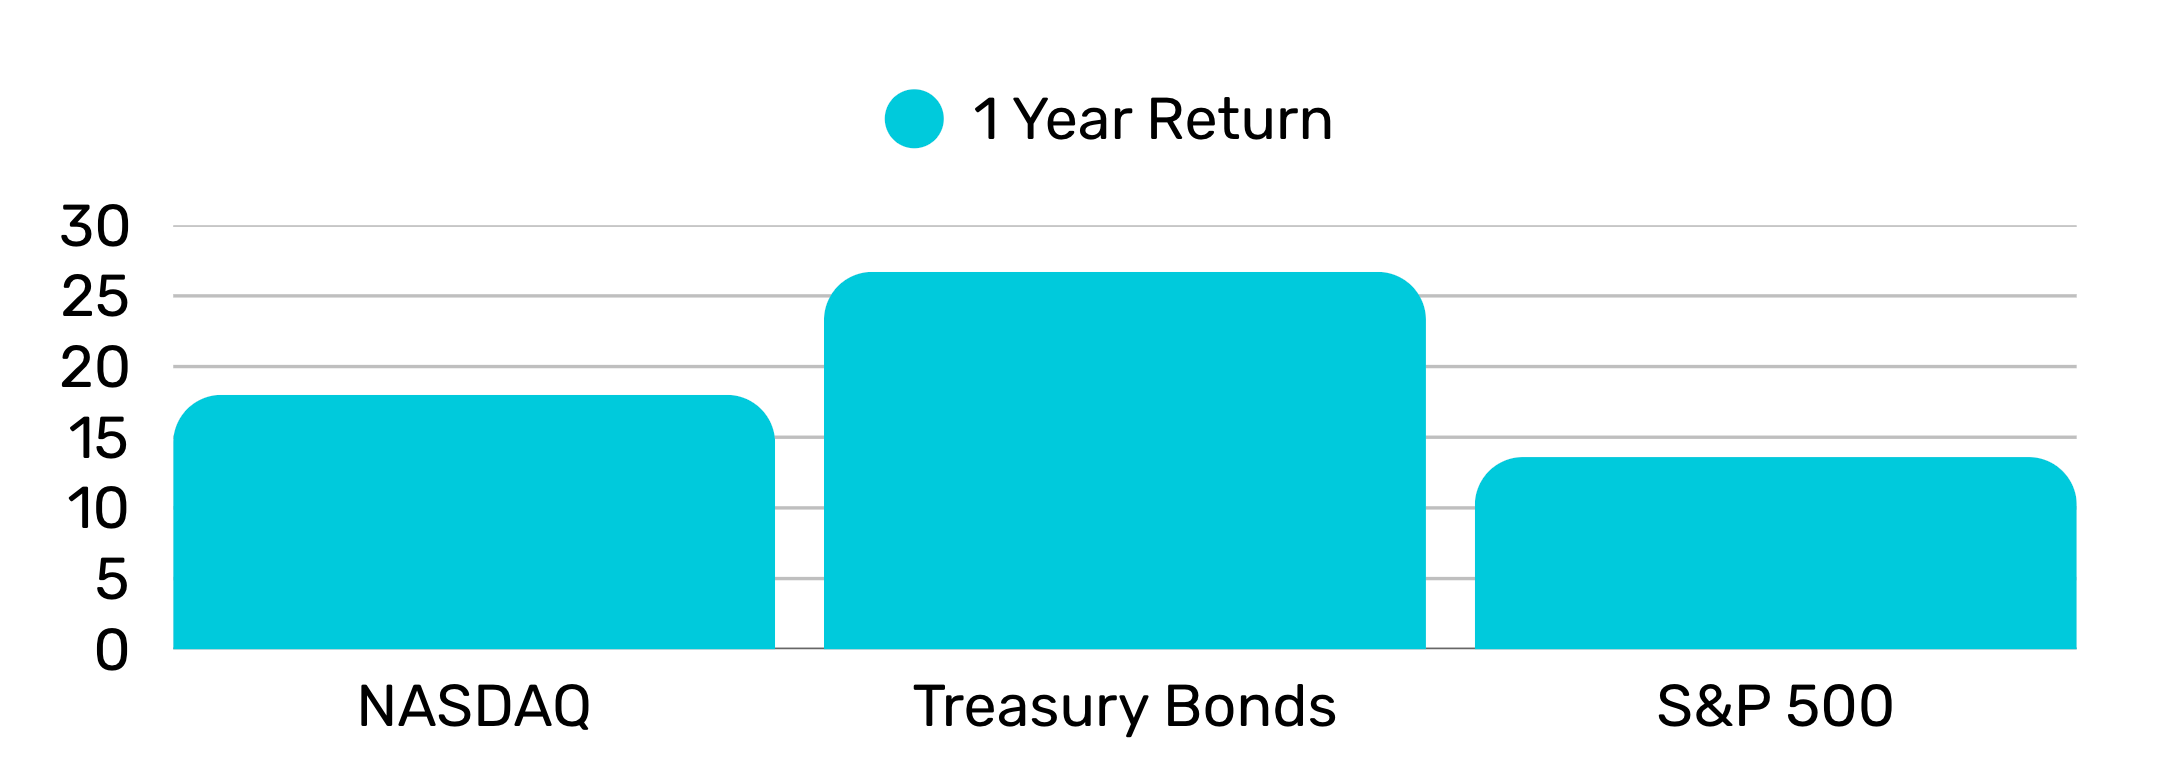
Each script analyzes historical performance across a given time series and a selection of ETFs. Script 1 may not have the same universe of ETFs to choose from as Script 2. This approach captures short-term shifts, medium-term trends, and long-term market cycles. For instance, in the chart below showing yearly returns for three sectors, a given script might allocate to Treasury Bonds if they outperform SPY and QQQ on a year-over-year basis.
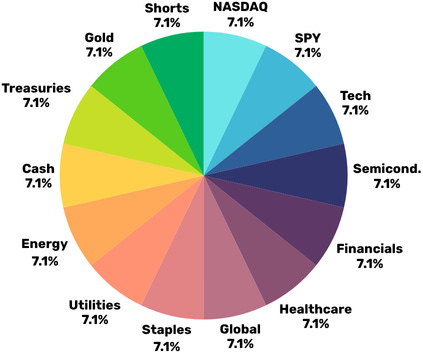
Tactical Portfolio Composition
By combining outputs from multiple rules-based algorithms, the Stratum Modular ETF strategy allocates a percentage of total assets to tactical positions. For example, one algorithm might select Gold, another Utilities, and another the S&P 500—each behaving differently for distinct reasons, ensuring a balanced and adaptive approach.
The Business Cycle
A key contribution to the modular script architecture is State Street's business cycle framework, which analyzes decades of market sector relationships across economic cycles. For example, during recoveries, sectors like Consumer Discretionary often outperform the broader market. These historical relationships serve as crucial data points that inform the Stratum Modular ETF Strategy’s allocations.
State Street's Business Cycle framework, based on the Conference Board's Leading Economic Index (LEI) introduced in the 1960s, categorizes economic activity into four phases: Recession, Recovery, Expansion, and Slowdown. By integrating Kenneth French’s data, it analyzes sector performance across seven recessions, 12 expansions, and 11 slowdowns using metrics like average returns and hit rates (periods of outperformance).
Recession: The LEI troughs, signaling contraction. Consumer Staples, Utilities, and Health Care thrive with 86%-100% hit rates.
Recovery: The LEI rebounds, signaling growth. Consumer Discretionary and Real Estate lead with 57%-86% hit rates.
Expansion: The LEI rises above trends, driven by demand and profits. Technology and Financials excel with 82%-91% hit rates.
Slowdown: The LEI peaks as growth slows. Health Care and Consumer Staples perform defensively with 73% hit rates.
By combining LEI cycles with sector data, State Street offers insights for constructing portfolios tailored to economic conditions. (Bartolini et al., 2019)
Methodology
By examining key sectors and their relative performance, we can make high probability educated guesses about the economy's current phase.
For instance, if the Utilities sector outperforms Technology, it may indicate an approaching recession. However, such indicators are not definitive; they could signal de-leveraging or a shift in investor preference from high-growth sectors like the Nasdaq to more stable options like Utilities.
Selection Criteria
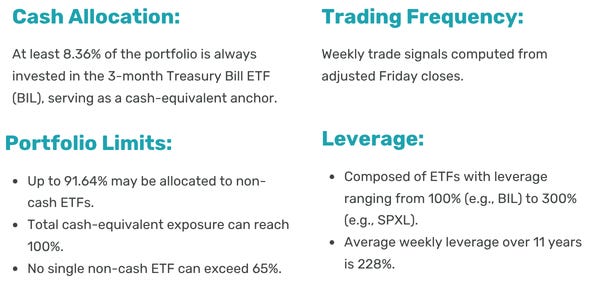
Selection is based on both 12-month rolling correlations and intentional diversification—some scripts deliberately exclude assets included in others. This approach reduces redundant exposure, enhances diversification, and maintains balanced risk without overfitting. Roughly 55% of the portfolio follows a 65/30/5 allocation across a primary asset, secondary asset, and 5% allocated to cash. Asset order adjusts with market dynamics—for example, QQQ and TLT might be held at 65/30, but in a high-volatility environment, that could shift to TLT and GLD.
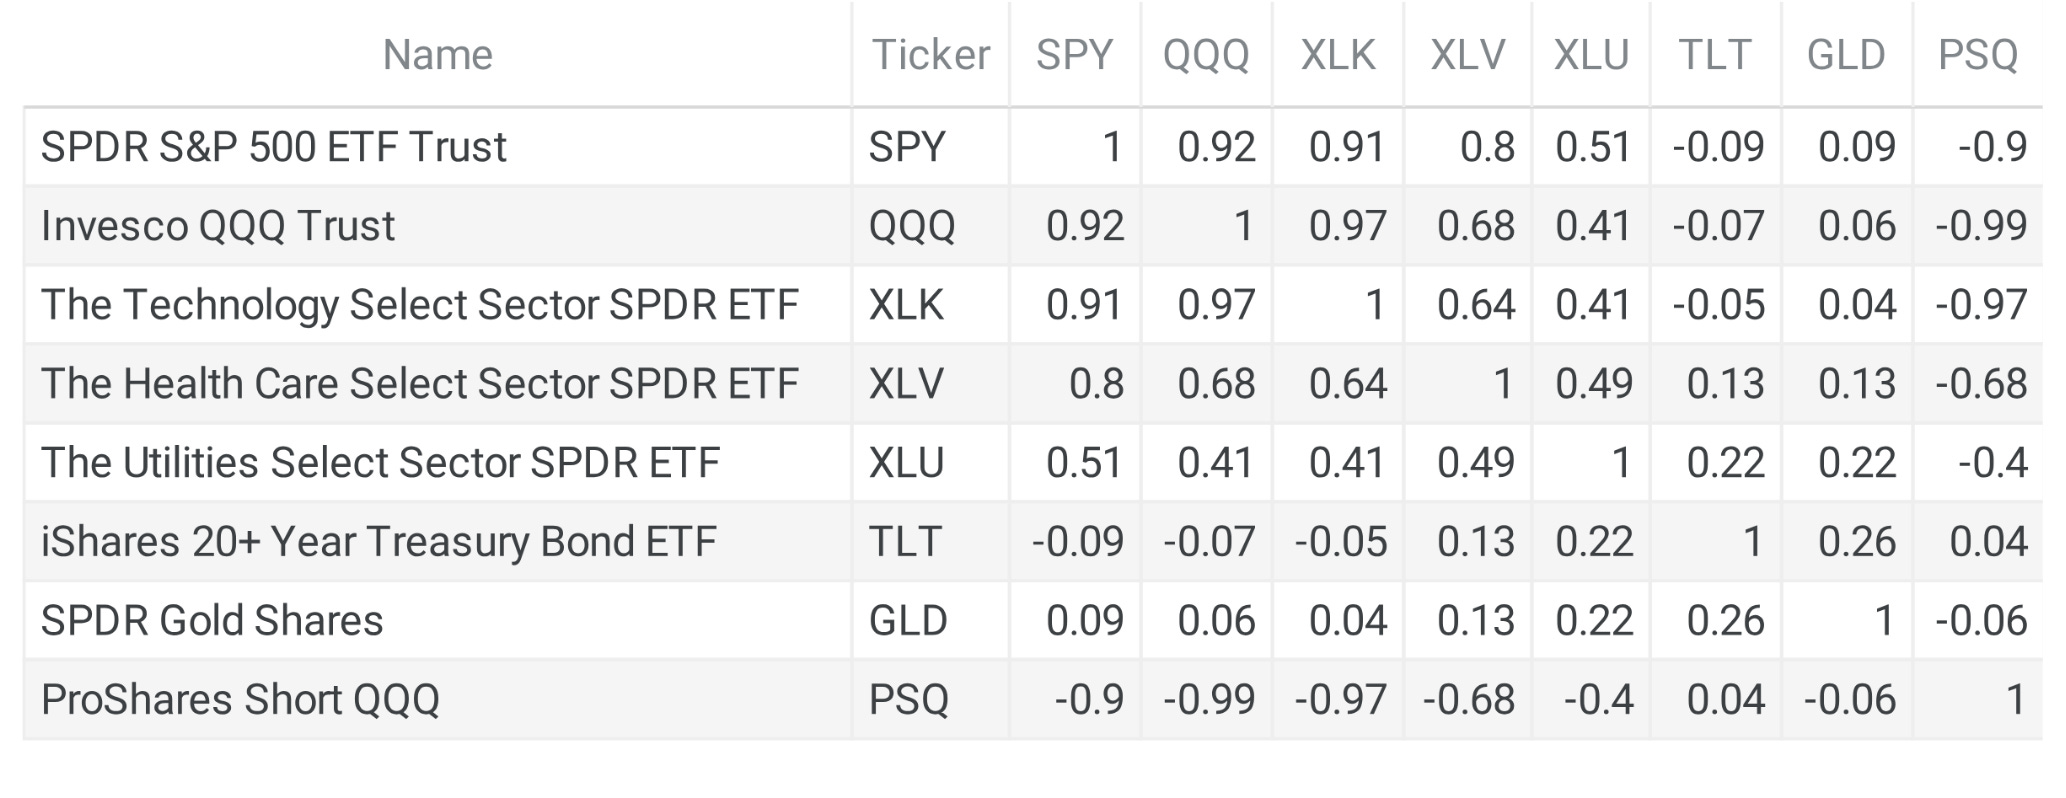
Correlation is not Causation
Correlation reflects how assets tend to move in relation to one another, but it doesn’t guarantee consistent behavior. Combining assets with varying correlations builds portfolio resilience—at the cost of total expected returns, which is the core premise of hedging. This positions the Stratum Modular ETF Strategy to perform across a range of market environments.
A correlation matrix measures how assets move in relation to each other, with values ranging from -1 to 1:
1.00 = Perfect positive correlation (move together)
0.00 = No correlation (independent)
-1.00 = Perfect negative correlation (move in opposite directions)
Turnover & Liquidity
In the early versions of the Stratum Modular ETF strategy, ETFs only needed a few thousand shares of daily trading volume for inclusion. Most names proved liquid enough, yet stress points appeared: bid–ask spreads could swell from $0.03 per $100 traded to $0.30 per $100, magnifying turnover costs.
To reduce this drag, we removed higher-friction positions such as LTL and UCC. Some funds, however, remain indispensable. UPW, with roughly 9,300 shares changing hands daily, is still in the Index because utilities provide a unique defensive anchor. Although a more liquid 3x alternative exists, its added leverage has not delivered superior risk-adjusted returns in backtests.
ETF Selection Rules for the Stratum Modular ETF strategy
Liquidity: ETFs should trade thousands of shares daily (ideally millions).
Leverage: Prefer 2–3x ETFs; exclude 3x if history is less than 10 years.
Spreads: After-hours bid–ask spreads should be <1% (ideally <0.1%).
Turnover: ETFs with high frictions may be excluded.
Sectors: Unique exposures (e.g., UPW for utilities) are retained despite lower liquidity.
Turnover as Risk Management
On an average week, 22.5% of the portfolio changes hands. That equates to ~11.7× annual turnover and an average ETF holding period of 2.25 weeks.
Weekly turnover: 22.5% of the portfolio
Annualized turnover: 11.7×
Average ETF holding period: 2.25 weeks
The Stratum Modular ETF strategy’s cadence is systematic and repeatable, frequent enough to sidestep crashes and stay aligned with momentum, yet deliberate enough to remain practical for real investors.
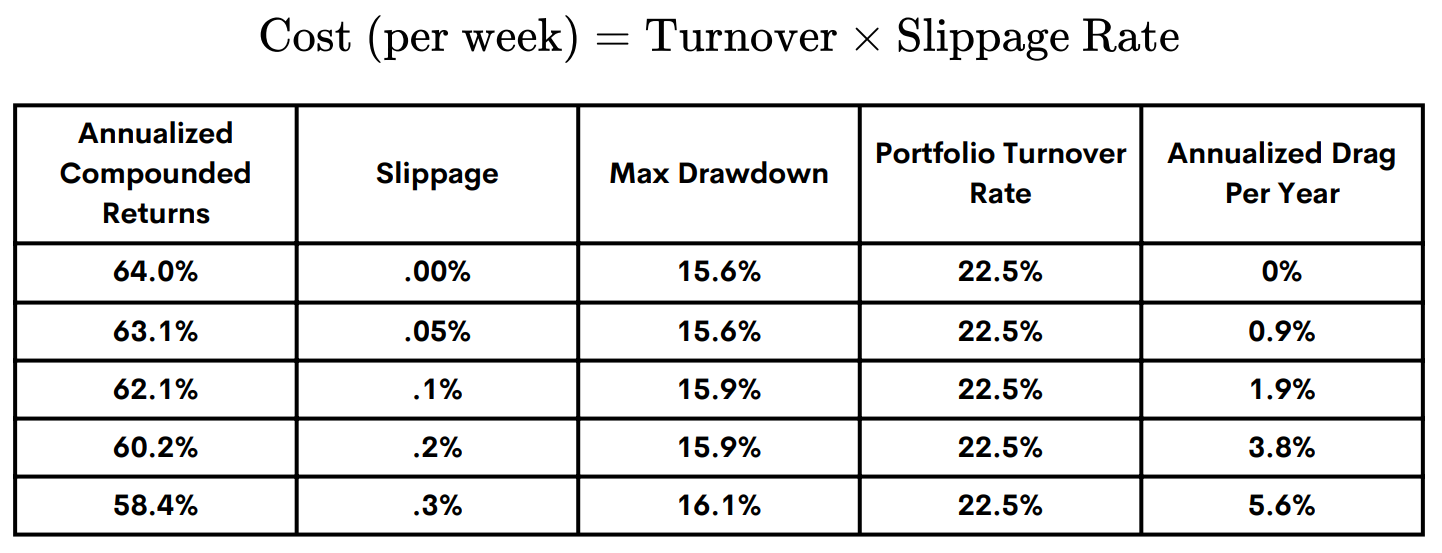
Modeling Trading Costs
Tiingo’s adjusted total-return data use market prices, adjusted for dividends, splits, fund-level expenses, and corporate actions, consistent with CRSP-style total-return methodology. These adjustments capture the performance of holding each ETF, they assume ideal execution at the National Best Bid and Offer (NBBO), the midpoint between the bid and the ask.
The Stratum Modular ETF Strategy runs on a Friday-to-Friday cycle, signals are computed from Friday closing data, trades are executed at Friday’s close, and performance is measured Friday close to Friday close. To approximate real execution, we add a small slippage adjustment for spread crossing, after hours fills, and routing latency, reflecting the friction of weekly rotation during volatility or thin liquidity. The Modular ETF strategy incorporates a modeled slippage of 0.18% at 22.5% weekly turnover.
On a pre-slippage basis, the strategy produced 64.0% annualized returns, a 15.6% maximum drawdown, and a 2.70 Sharpe ratio. Including the trading-cost assumptions reduces returns modestly, the strategy’s behavioral rotation edge and structural efficiency remain intact.
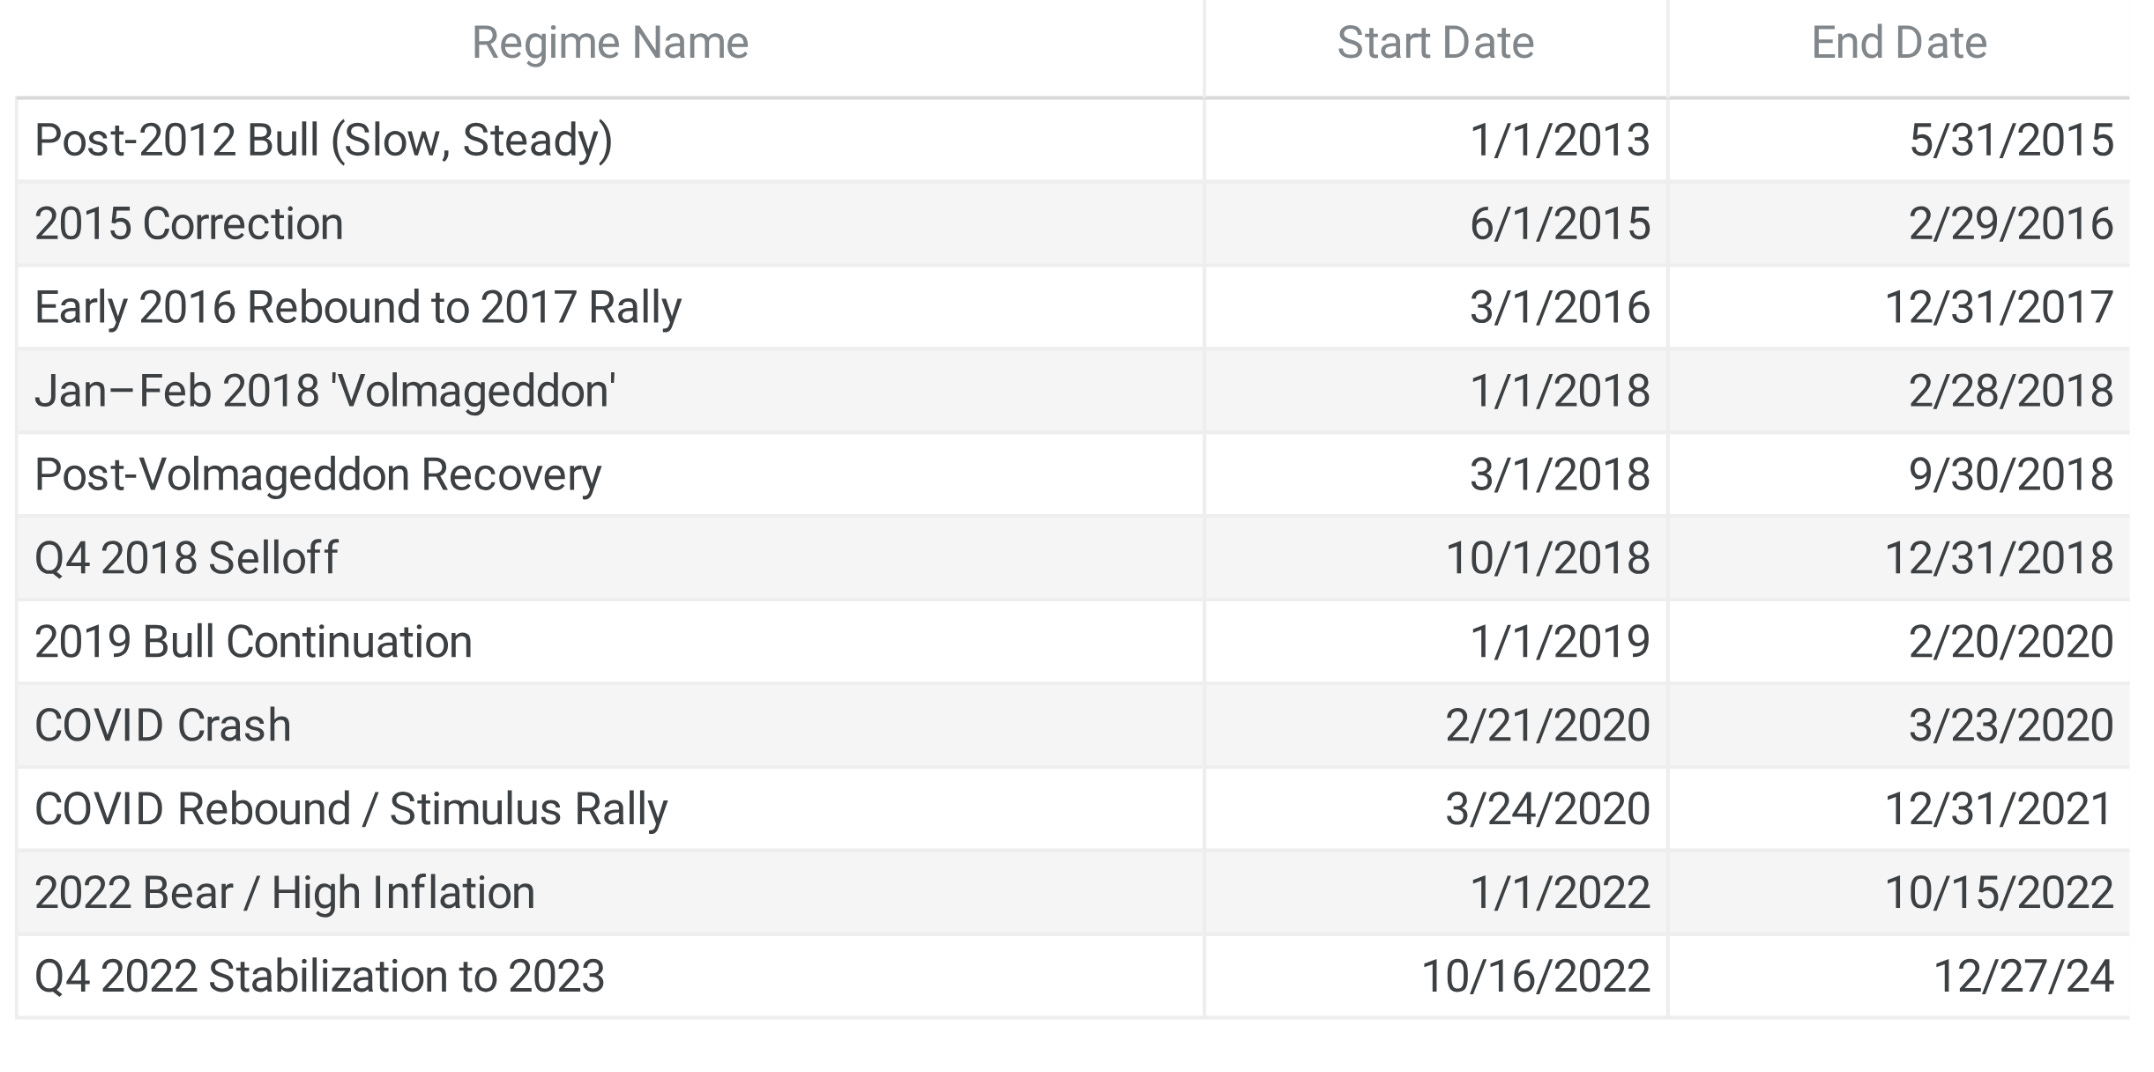
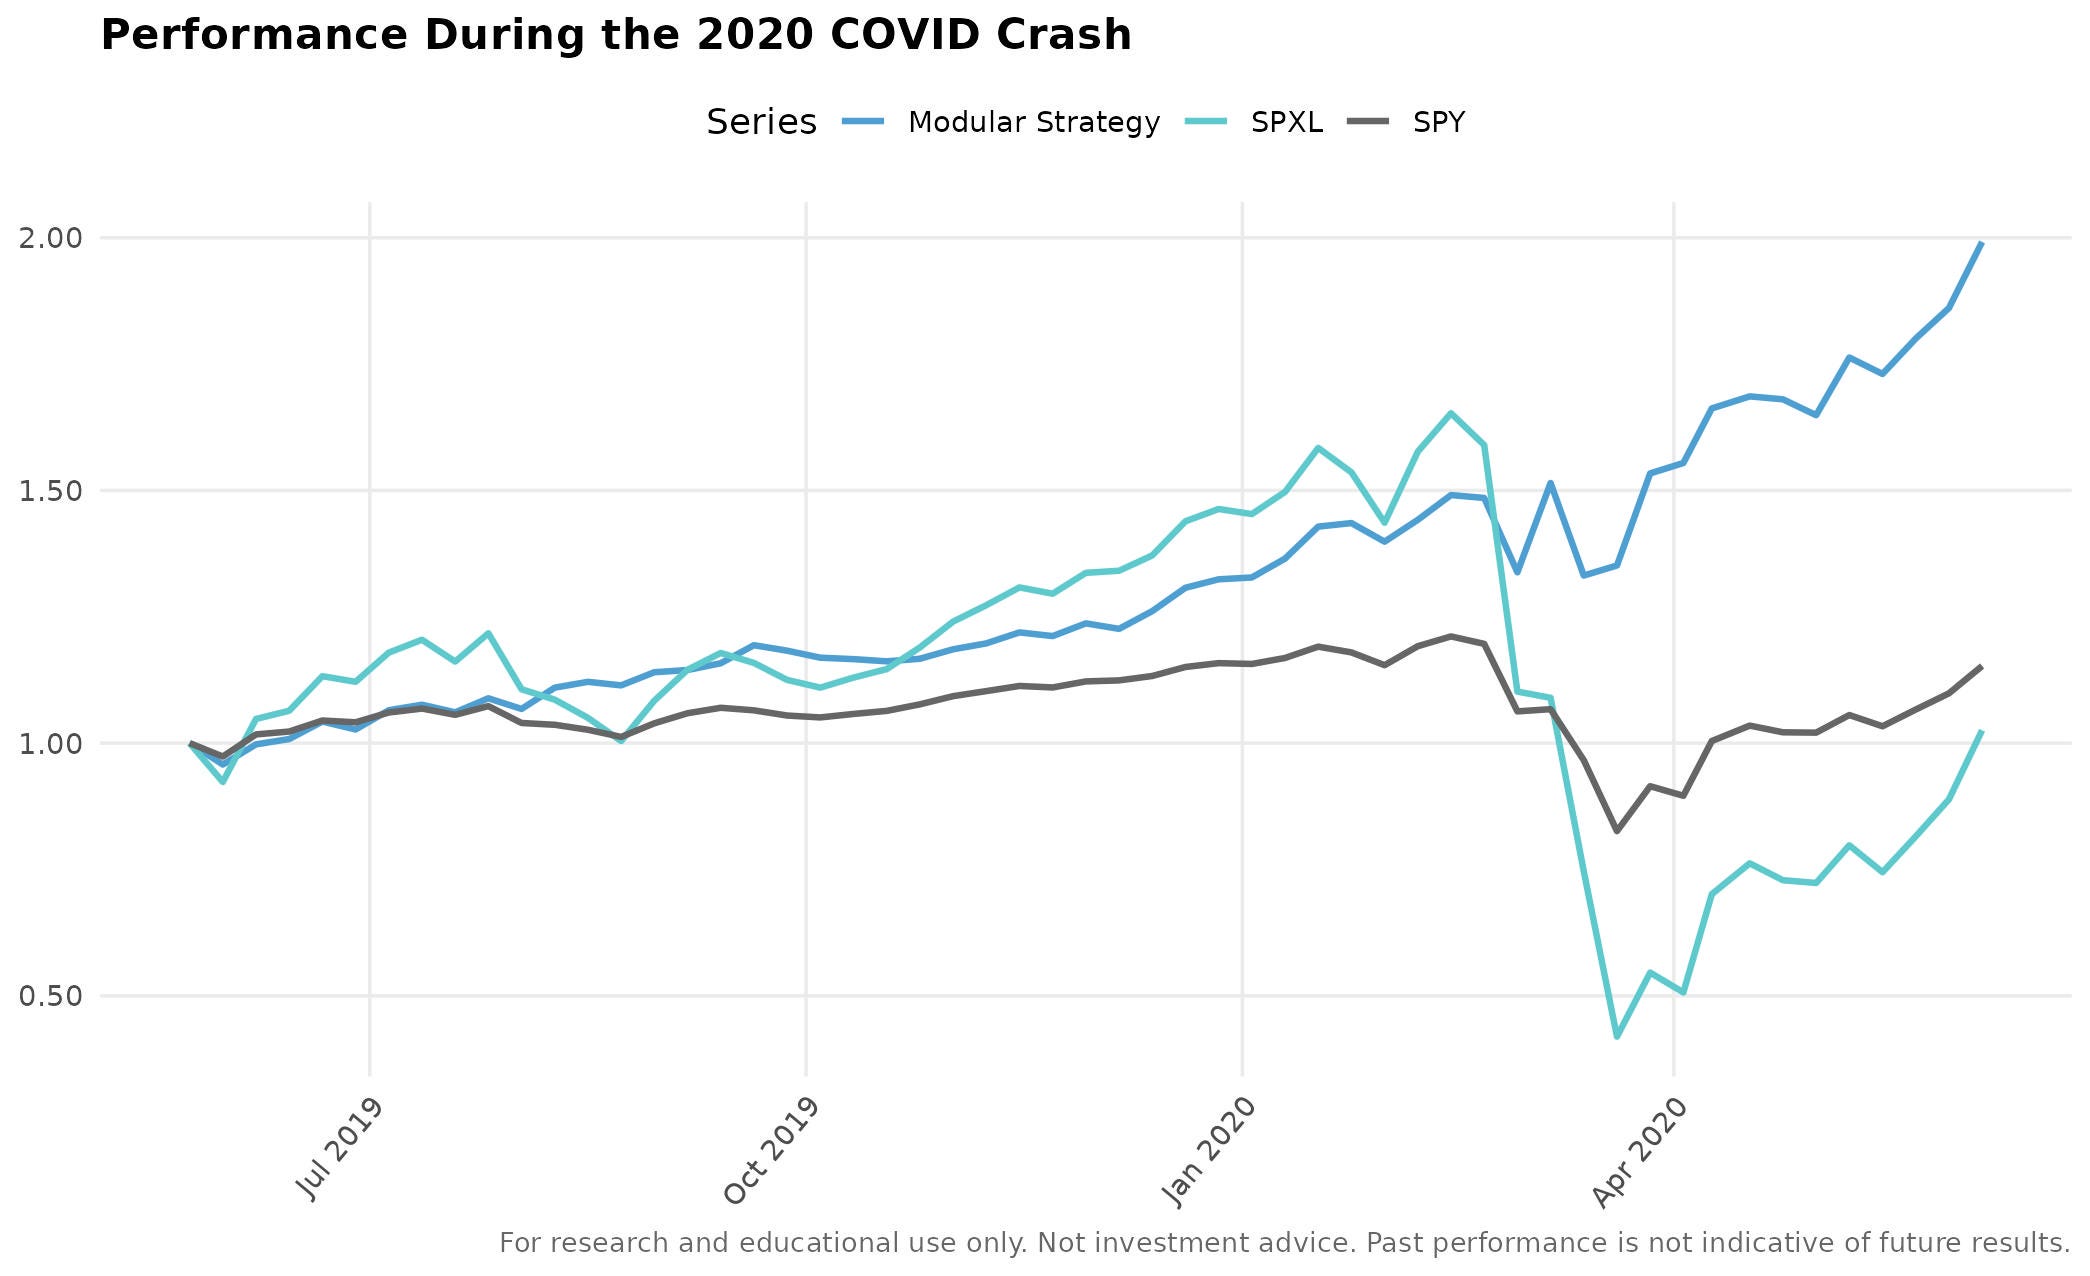
Market Regimes
The 2020 COVID Crash
Timeframe: February 21, 2020, to March 27, 2020
Stratum Modular ETF strategy Performance During COVID-19 Market Turmoil:
Phase 1 – Initial Stock Crash (Feb 21–Mar 6, 2020): The Stratum Modular ETF strategy declined 2.01%, demonstrating resilience during the early equity selloff.
Phase 2 – Treasury Bond Crisis (Mar 9–Mar 18, 2020): After gaining 12.6% from early bond positioning, the strategy fell 10.4% during the sudden Treasury market dislocation, reflecting systemic stress across asset classes.
Benchmark Comparisons:
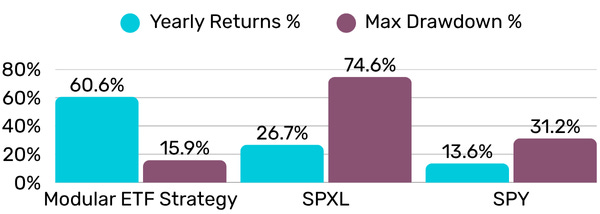
Modular ETF: MaxDrawdown of 12.1% during the broader market downturn.
SPY (S&P 500 ETF): MaxDrawdown of 31.8% during the broader market downturn.
SPXL (3x Leveraged S&P 500 ETF): MaxDrawdown of 74.6%, illustrating the amplified risk of leveraged exposure.
Performance Comparison During the 2020 COVID Crash
2018 ‘Volmageddon’: A Challenge for the Stratum Modular ETF Strategy
Timeframe: January 12, 2018, to June 8, 2018
The Stratum Modular ETF strategy showcased its adaptive approach by using tactical allocation and dynamic sector adjustments to navigate flash crashes and minimize volatility. However, like many momentum strategies, it is not immune to whipsaw effects—sharp market reversals that can temporarily reduce its effectiveness and highlight a key weakness in such approaches.
Comparative Performance:
Modular ETF: MaxDrawdown of 15.9%
SPY (S&P 500 ETF): MaxDrawdown of 9.6%
SPXL (S&P 500 ETF): MaxDrawdown of 28.5%
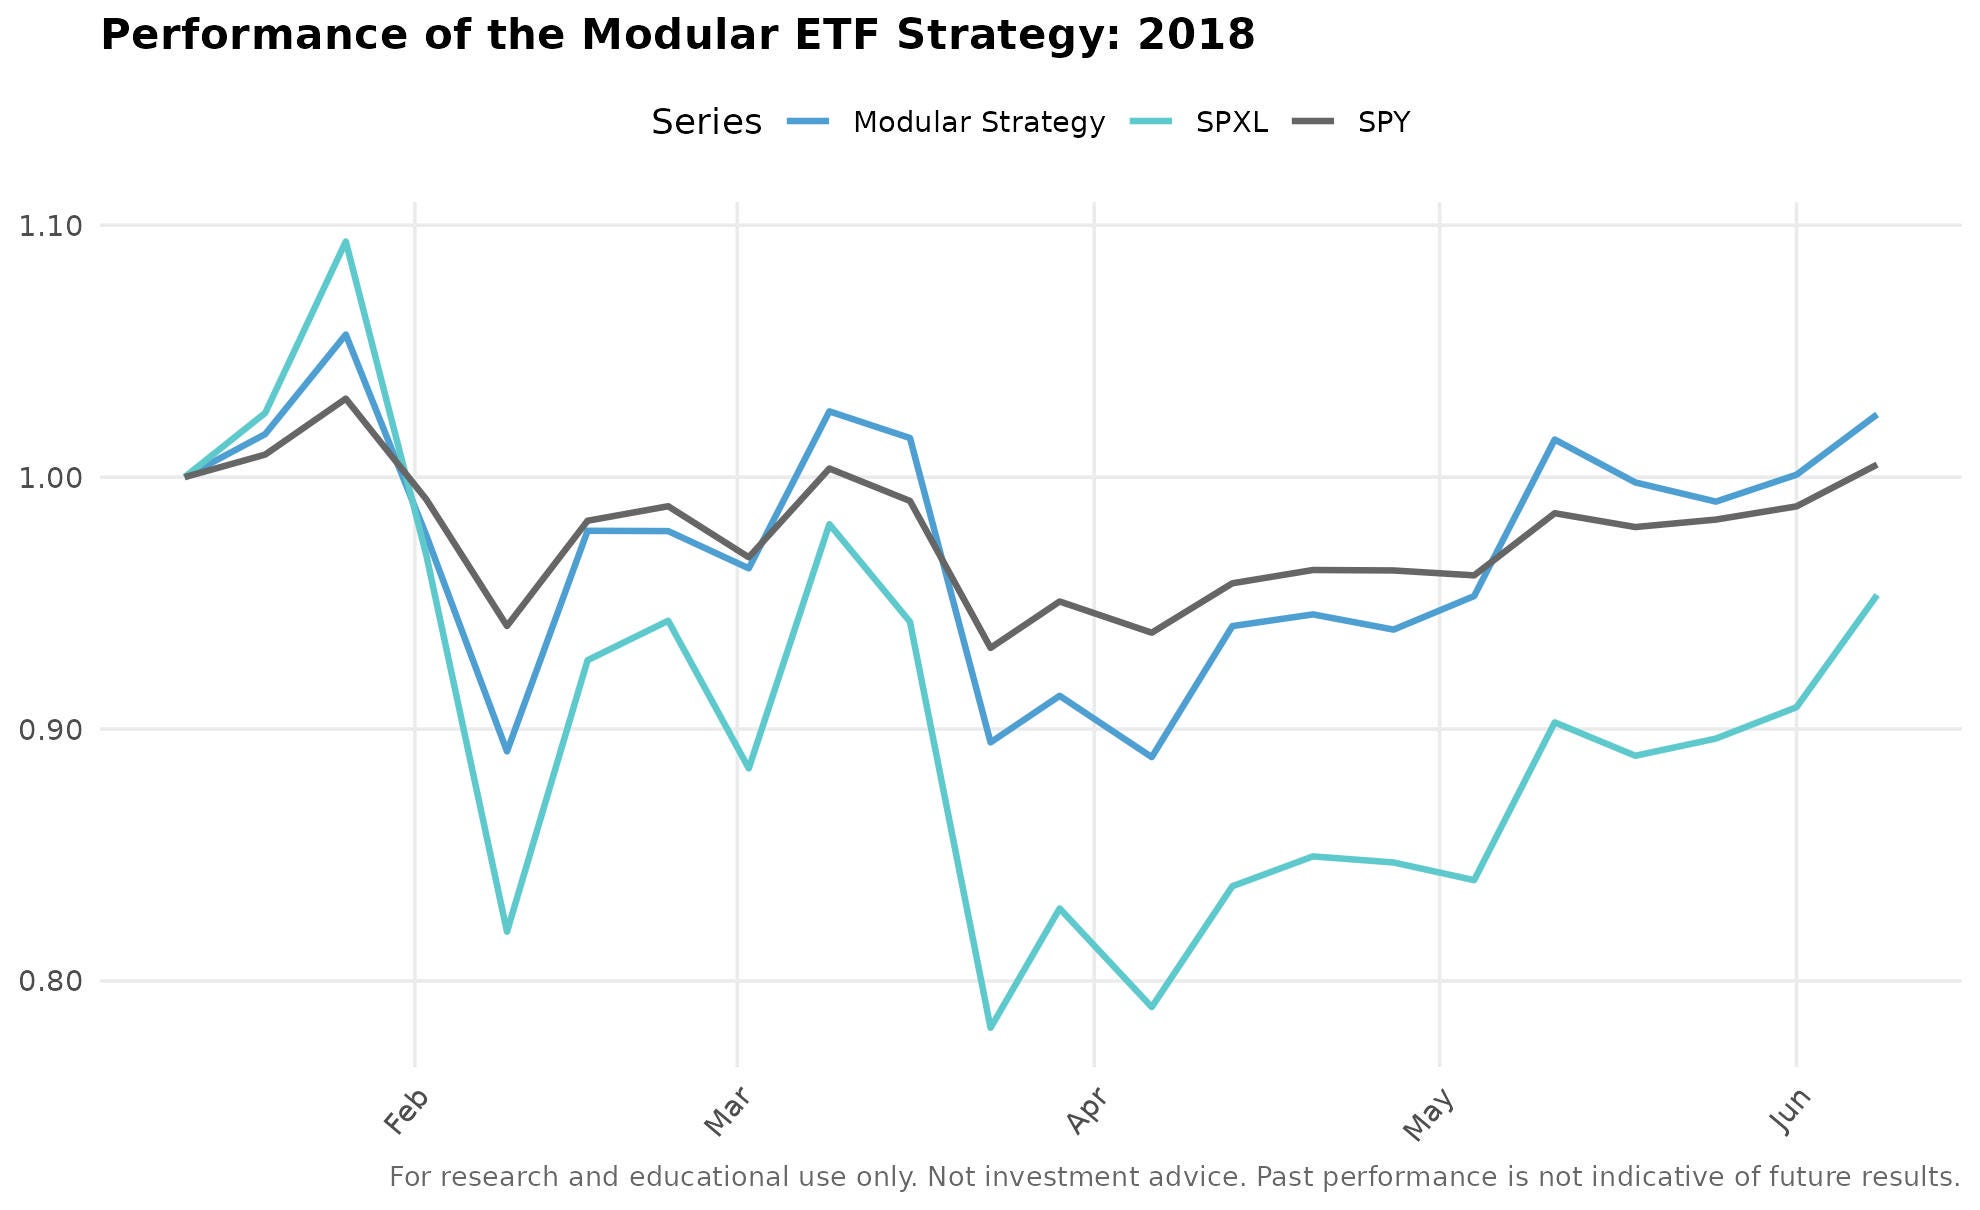
Performance of the Stratum Modular ETF Strategy: 2017-2018
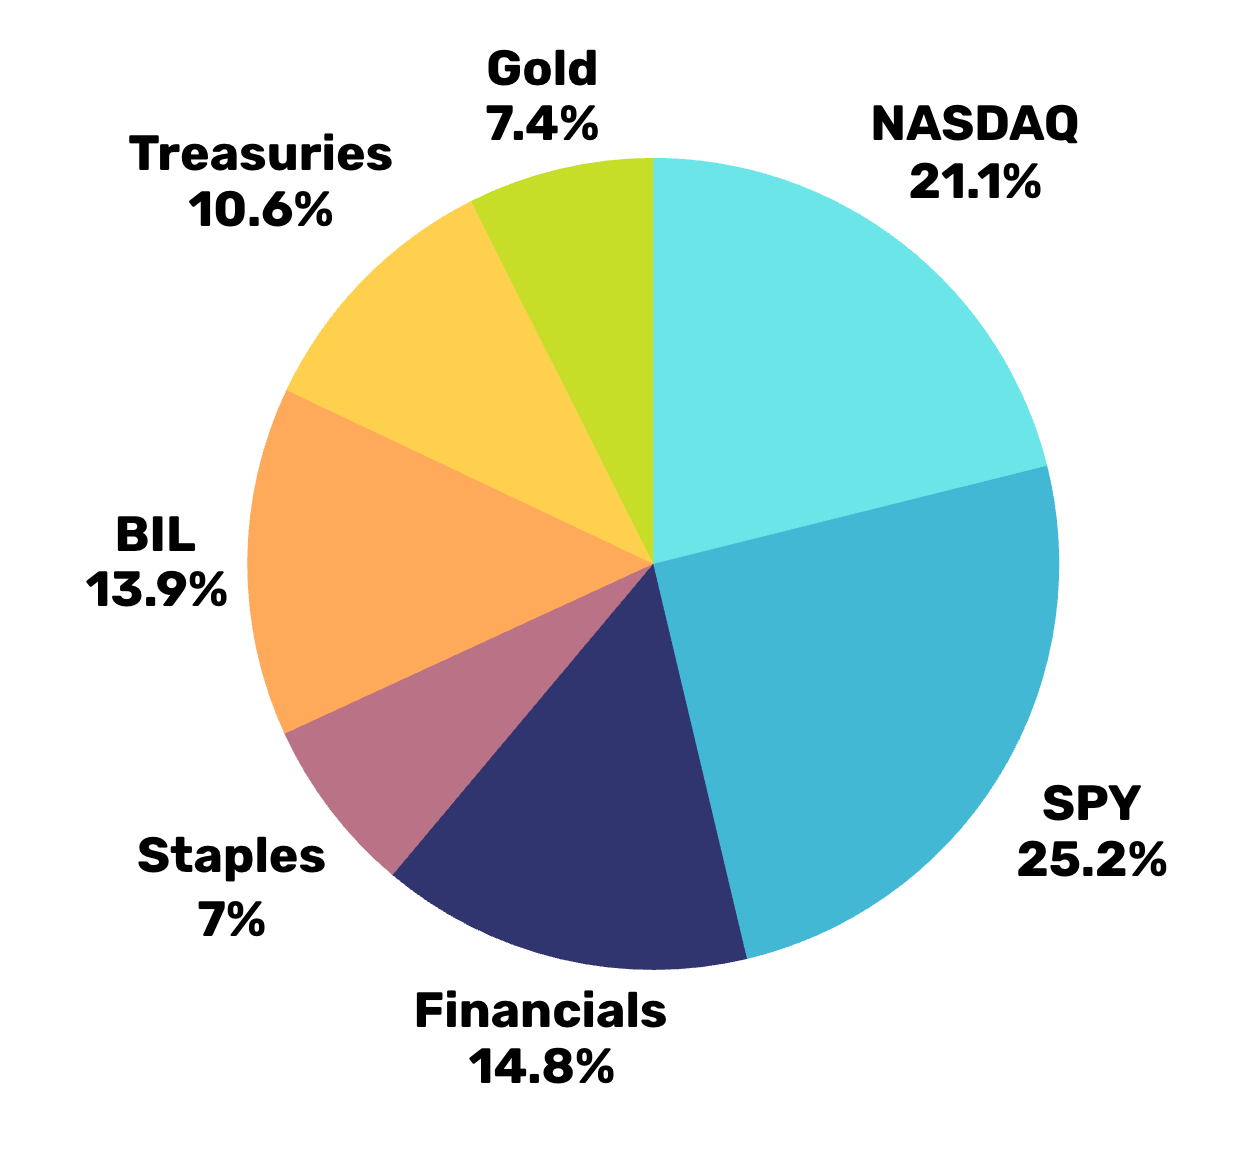
Starting February 2, 2018, without prior warning, and just before the significant VIX spike, the Stratum Modular ETF strategy was strategically allocated across a mix of offensive and defensive sectors, including 13.9% in Cash, 10.6% in Treasuries and 7.4% Gold.
Allocation of the Stratum Modular ETF Strategy February 2, 2018
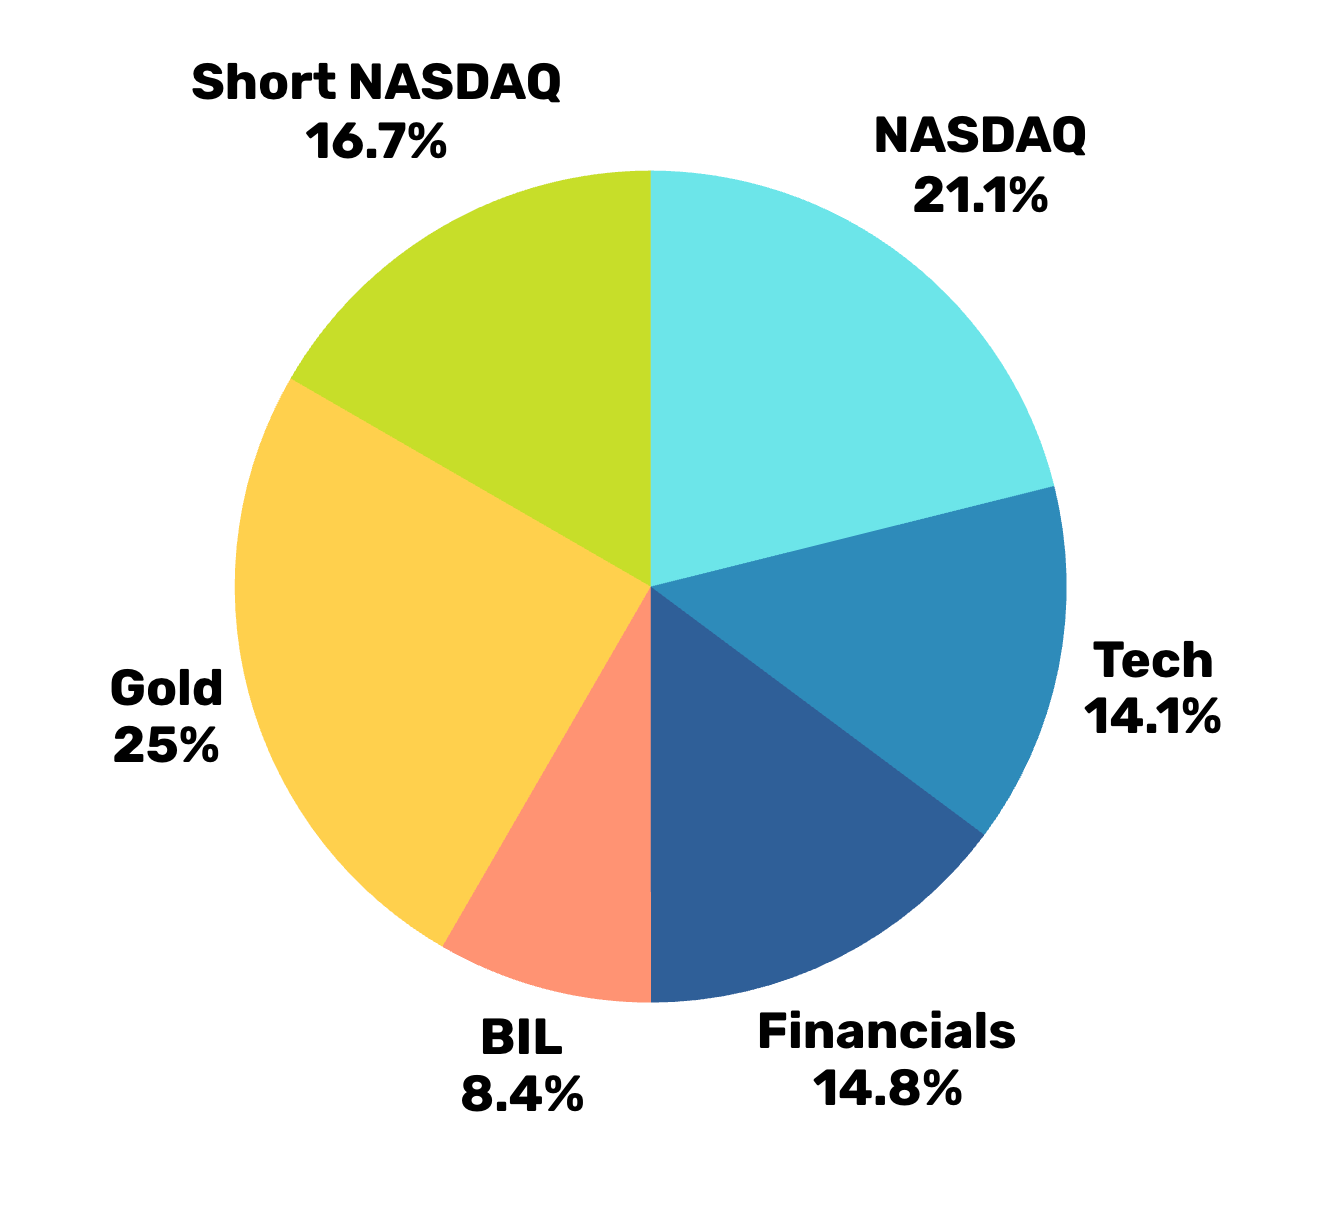
By the week of March 2, 2018, allocations had shifted to 16.7% shorts, 8.4% Cash, and 25% Gold, highlighting the algorithm’s tactical hedging capabilities. Notably, bonds underperformed during ‘Volmageddon,’ and the algorithm had already reallocated assets accordingly. Activating under high-probability conditions. Had the market continued to decline, the algorithm would have progressively adjusted further to safeguard the portfolio.
Allocation of the Stratum Modular ETF Strategy March 2, 2018
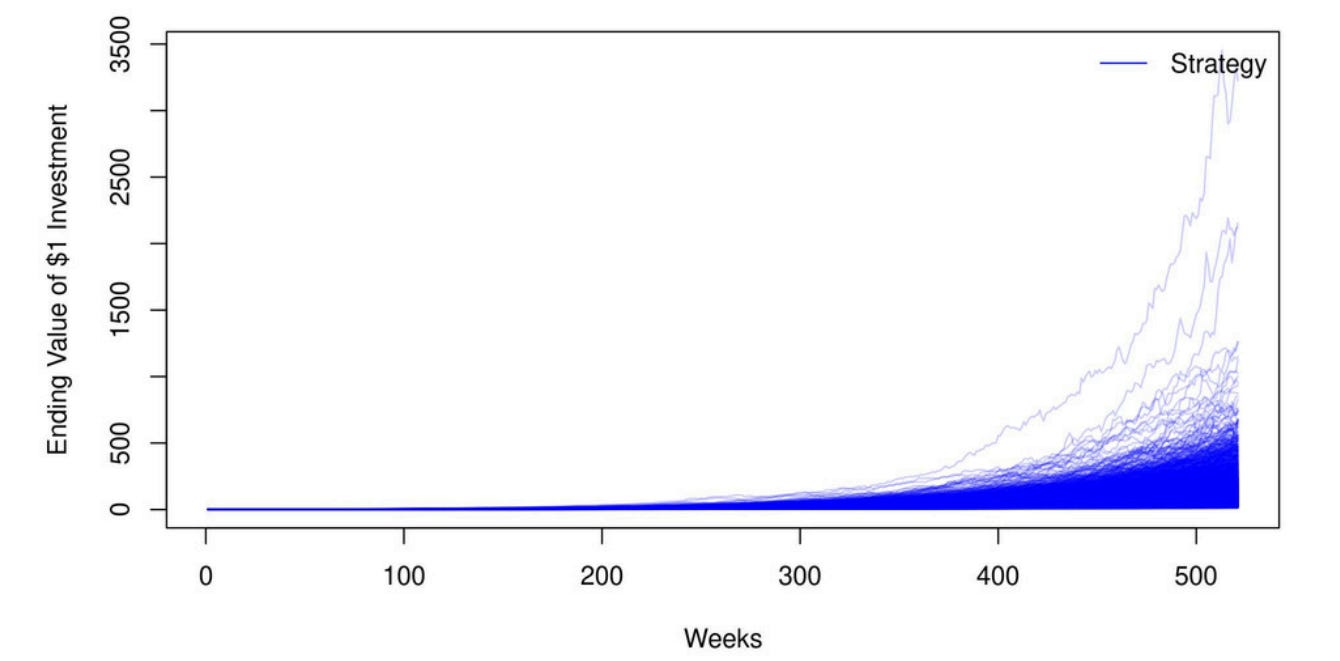
10-Year Monte Carlo Simulations
We ran 3,000 Monte Carlo simulations using bootstrapped returns, a method that resamples actual weekly data with replacement. This means each simulated path is built by randomly drawing from the strategy’s real historical returns—some weeks may appear multiple times, others not at all. The advantage is realism: bootstrapping preserves the true sequence of volatility spikes, drawdowns, and fat tails that define markets.
10-Year Monte Carlo (Bootstrap): Percentile Breakdown of Strategy Returns
For research and educational use only. Not investment advice. Past performance is not indicative of future results.
Monte Carlo Simulations: Analyzing 10-Year Performance
3,000 Monte Carlo simulations with replacement covering a 10-year period.
Results grouped into deciles, with each decile representing the average performance of 300 simulations.
Bottom 10% (Decile 1): Average Compound Annual Growth Rate (CAGR) of 40.88%
Top 10% (Decile 10): Average CAGR of 83.4%
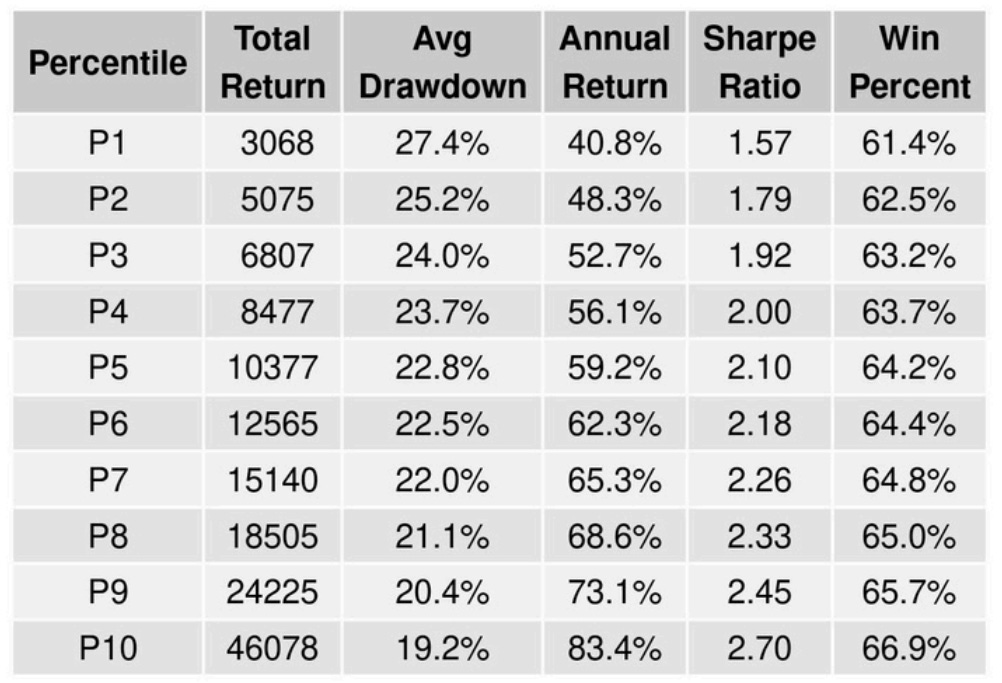
10-Year Monte Carlo Simulation (Bootstrap): Metrics by Return Percentile
For research and educational use only. Not investment advice. Past performance is not indicative of future results.
Bootstrap with Replacement Key Takeaway:
There is a high probability that the Stratum Modular ETF strategy’s performance — in terms of CAGR and max drawdown — would fall within the range shown in the table:
CAGR Range: From 40.8% (P1) to 83.4% (P10)
Avg. Max Drawdown Range: From 27.4% (P1) to 19.2% (P10)
This means that even in the lowest 10% of simulated outcomes (P1), the Stratum Modular ETF strategy’s average simulated CAGR was 40.8% over the 10-year period, accompanied by a 27.4% maximum drawdown. These results are hypothetical and for illustrative purposes only, highlighting the model’s historical risk-return characteristics under randomized market conditions.
DATA & METHODOLOGY
Data source: Tiingo adjusted ETF prices (total-return basis). Prices are adjusted for dividends, splits, and corporate actions, reflecting actual market prices rather than NAVs.
Frequency: Weekly returns computed from adjusted Friday closes.
Frequency: Weekly trade signals computed from adjusted Friday closes.
Test Period: Oct 25, 2013 to Dec 27, 2024.
Execution pricing: Tiingo uses the midpoint of the National Best Bid and Offer (NBBO) across major exchanges to represent end-of-day prices. This midpoint approximates a fair execution price between buyers and sellers, removing outliers from irregular prints.
Fees: ETF-level expense ratios and reinvested dividends are already reflected in Tiingo adjusted data.
Execution assumptions: The backtest does not perfectly model bid-ask spreads or brokerage commissions.
Slippage: Real-world execution costs vary by broker, order type, and market conditions. A 0.18% weekly friction estimate was applied at an estimated 22.5% weekly turnover to approximate average slippage.
Benchmark: SPY is used as a behavioral reference benchmark for comparison only.
Rebalancing: Model allocations update weekly based on closing data; results assume continuous capital and perfect execution.
Backtest measurement: Backtests use discrete sampling between observation dates to determine maximum drawdown. If a drawdown occurs between two measurement points, this is known as ‘timing luck’ the result of how returns are partitioned over time rather than a change in the underlying process.
DISCLAIMER
This publication is for educational and research purposes only and does not constitute investment advice or a recommendation to buy or sell any security. Past performance, whether simulated or actual, is not indicative of future results. All results are hypothetical and based on model logic as implemented within the Stratum framework.
© Quanta72 For educational use only
Appendix
Antonacci, Gary (2014). Dual Momentum Investing: An Innovative Strategy for Higher Returns with Lower Risk. McGraw-Hill Education, Kindle Edition (pp. 131–132).
Antonacci, Gary (2014). Dual Momentum Investing: An Innovative Strategy for Higher Returns with Lower Risk. McGraw-Hill Education, Kindle Edition (pp. 153–154).
Bajgrowicz, Pierre, and Olivier Scaillet (2012). Technical Trading Revisited: False Discoveries, Persistence Tests, and Transaction Costs. Journal of Financial Economics, 106(3), 473–491.
Bartolini, M., Dong, A., & SPDR Americas Research. (2019). Sector Business Cycle analysis (By US Department of Commerce & Bloomberg Finance L.P.). https://www.ssga.com/library-content/products/fund-docs/etfs/us/insights-investment-ideas/sector-business-cycle-analysis.pdf
Brock, William, Josef Lakonishok, and Blake LeBaron (1992). Simple Technical Trading Rules and the Stochastic Properties of Stock Returns. Journal of Finance, 47(5), 1731–1764.
Brown, David P., and Robert H. Jennings (1989). On Technical Analysis. Review of Financial Studies, 2(4), 527–551.
Fang, Jiali, Ben Jacobsen, and Yafeng Qin (2013). Predictability of the Simple Technical Trading Rules: An Out-of-Sample Test. Review of Financial Economics, 23(1), 30–45.
Fang, Jiali, Yafeng Qin, and Ben Jacobsen (2014). Technical Market Indicators: An Overview. Working paper.
Geczy, Christopher, and Mikhail Samonov (2012). 212 Years of Price Momentum (The World’s Longest Backtest 1801–2012). Working paper.
Isaac Newton pay order (1719). Isaac Newton pay order. The New York Public Library. Retrieved from https://www.nypl.org/events/exhibitions/galleries/empire-imagination/item/11057
Jegadeesh, Narasimhan, and Sheridan Titman (1993). Returns to Buying Winners and Selling Losers: Implications for Stock Market Efficiency. Journal of Finance, 48(1), 65–91.
Jegadeesh, Narasimhan, and Sheridan Titman (2001). Profitability of Momentum Strategies: An Evolution of Alternative Explanations. Journal of Finance, 56(2), 699–720.
Malkiel, Burton G. (1995). Returns from Investing in Equity Mutual Funds. Journal of Finance, 50(2), 549–572.
The South Sea Bubble of 1720 (2023). The South Sea Bubble of 1720. Historic UK. Retrieved from https://www.historic-uk.com/HistoryUK/HistoryofEngland/South-Sea-Bubble/
Wizevich, E. (2025). Scientists find the mysterious source of the massive 1831 volcanic eruption that cooled Earth and made the sun appear blue. Smithsonian Magazine. Retrieved from https://www.smithsonianmag.com/smart-news/scientists-find-the-mysterious-source-of-the-massive-1831-volcanic-eruption-that-cooled-earth-and-made-the-sun-appear-blue-180985784/
Zhou, Guofu, and Yingzi Zhu (2014). A Theory of Technical Trading Using Moving Averages. Working paper.
Disclaimer: The content in this post is for informational purposes only and does not constitute financial or investment advice.