
How to Build Your Own Stock Trading Algorithm (Step-by-Step)
A hands-on walkthrough for constructing a risk-aware trading strategy in Posit Cloud.

Introduction
Since late 2021, I’ve developed quantitative trading systems that study how momentum evolves across market cycles. That work led to the BetaMap Risk Score, a probability gauge that converts the Stratum Algorithm’s weekly allocations into a single reading of market posture.
Rather than forcing the market into a binary “risk-on” or “risk-off” label, the score places each week along a full behavioral spectrum. It reveals the transition zones, the subtle middle ground where capital begins rotating long before price exposes its direction.
The chart below shows how SPY performed from 2013 through 2024 when grouped by BetaMap Risk Score, measured by weekly returns and sorted into clean scoring buckets. Each bucket captures a distinct segment, offering a clear view of how probability aligned with modeled outcomes.
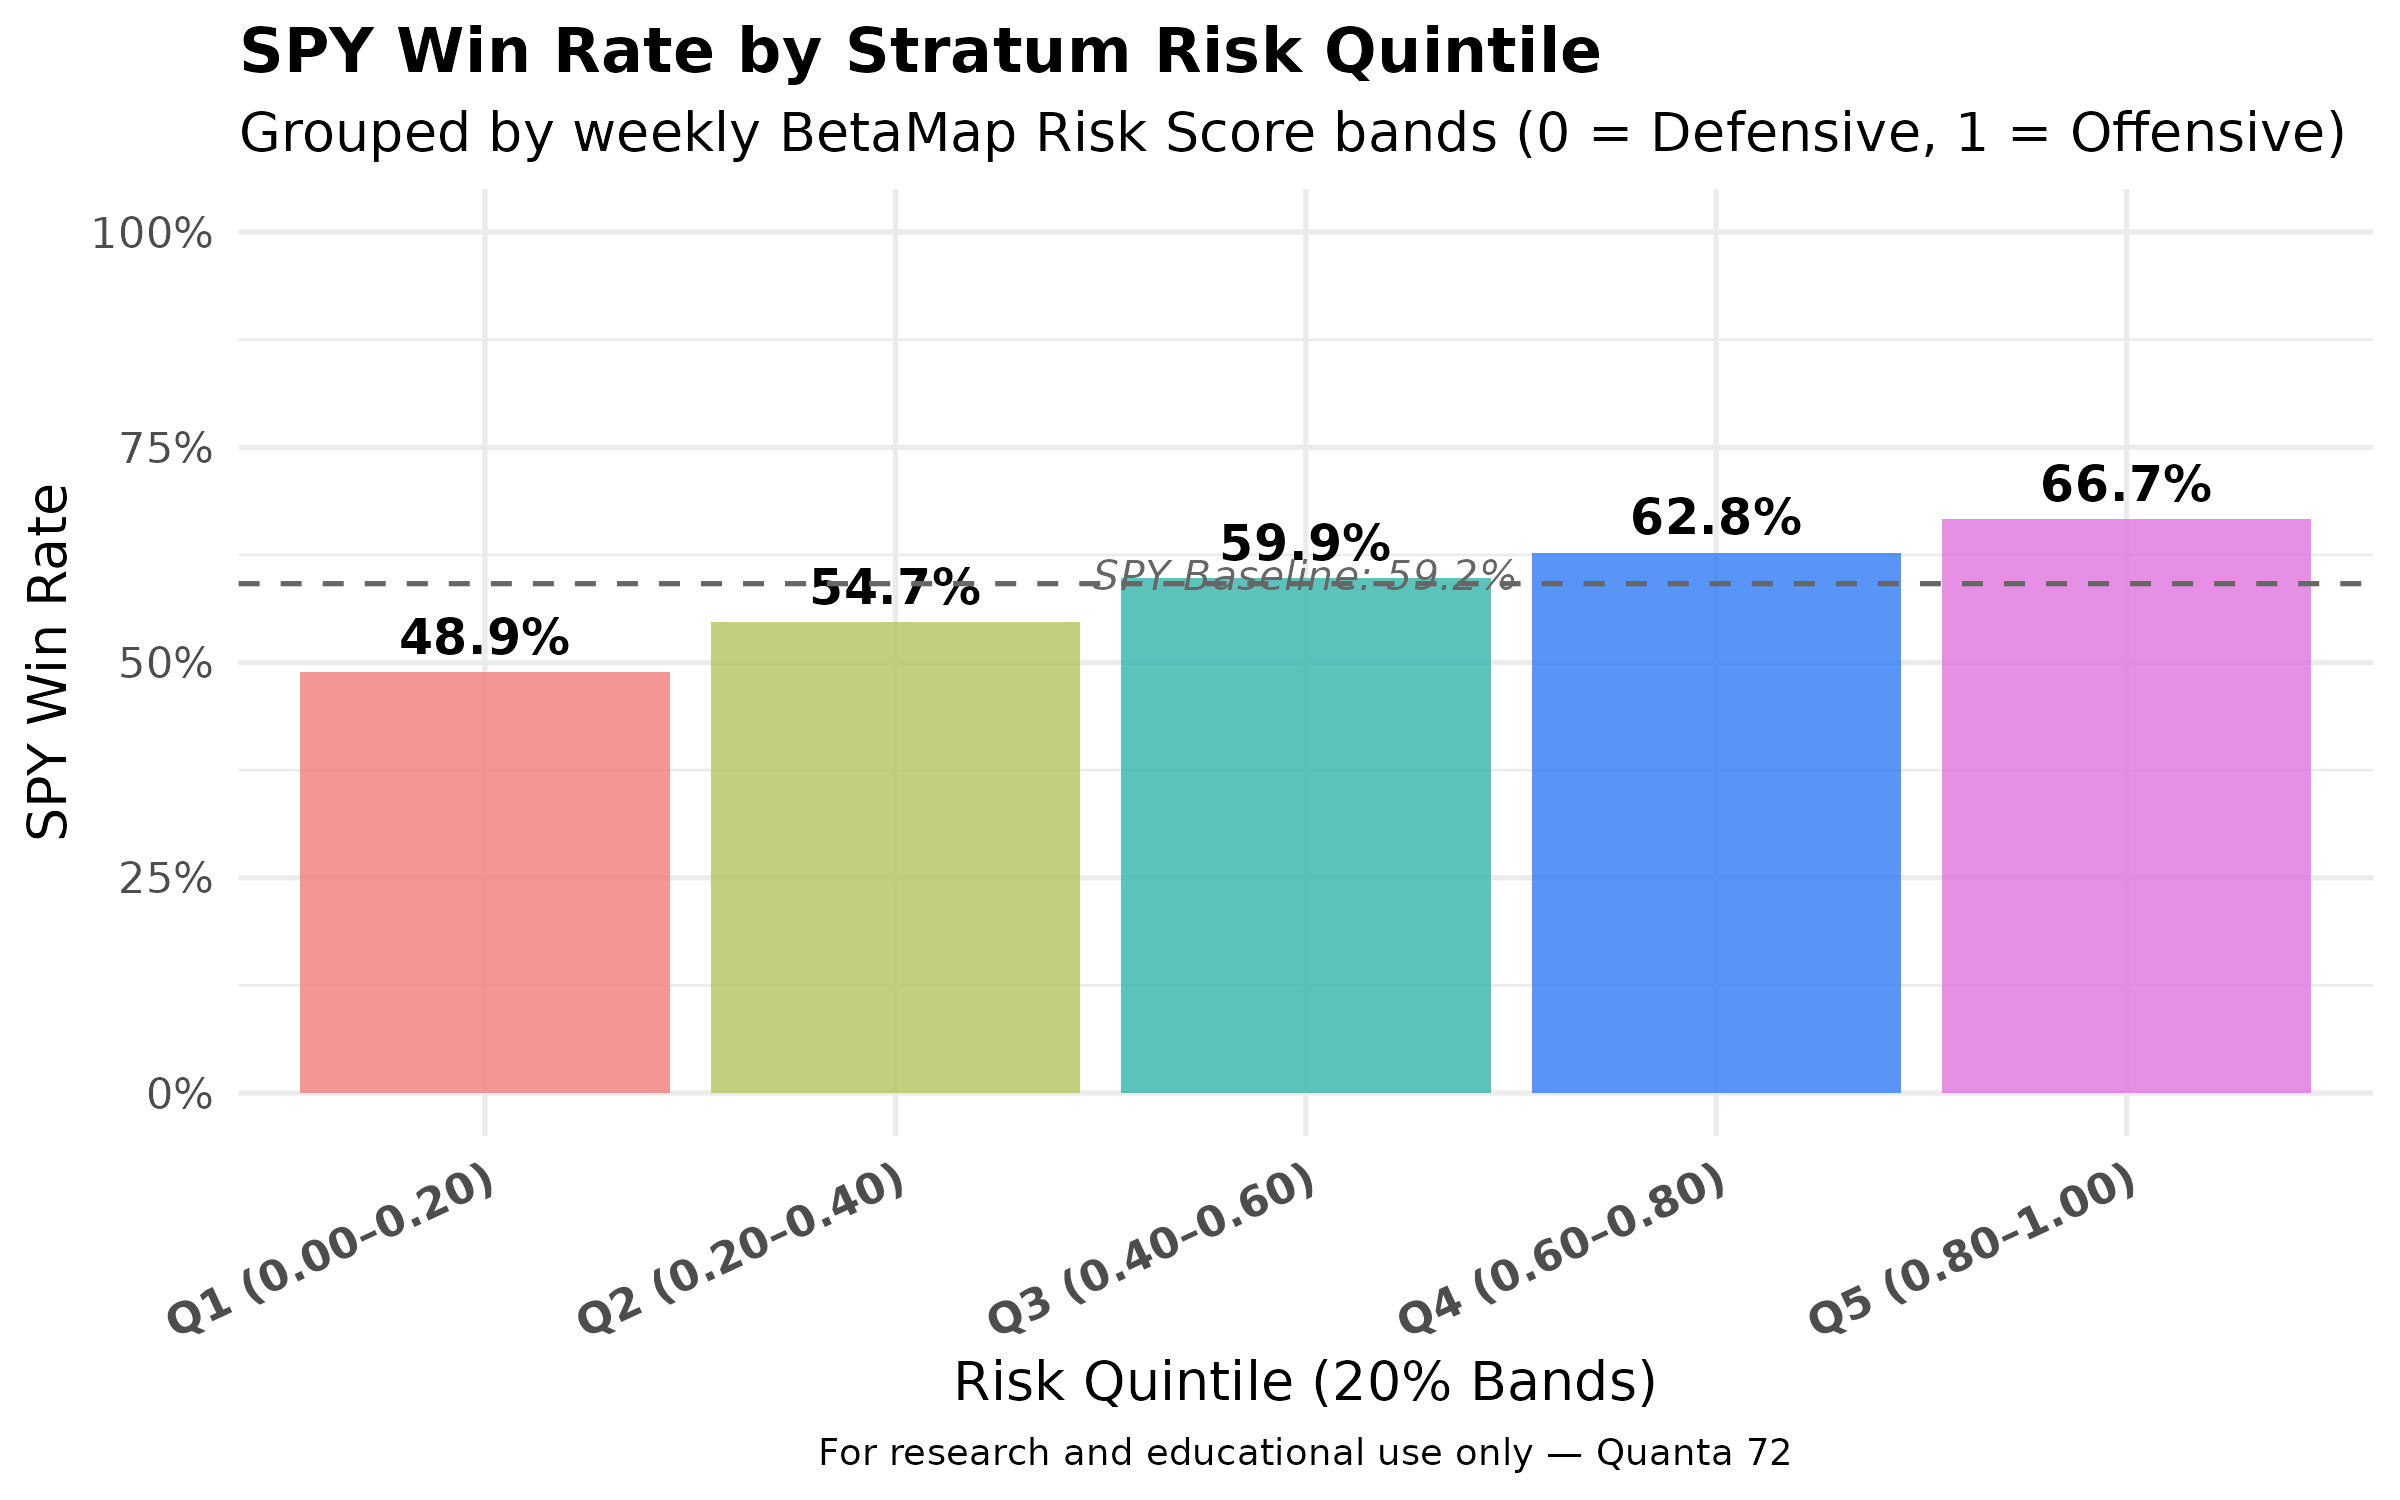
The strategy you’ll build here is a simplified version of a momentum trading model. It uses Friday-to-Friday data to assign ETF allocations to one of five risk quintiles.
Each quintile represents a balance between safety and risk, from cash and Treasuries at the defensive end to leveraged equities at the aggressive end.
The Risk Scores and allocations are lag-aligned, mirroring how a live model could execute.
Performance is benchmarked against SPXL, a 3× leveraged S&P 500 ETF.
What You’ll Need
You don’t need any prior setup beyond two free accounts and the provided data file.
Data Availability & Publication Timing
The BetaMap Risk Score are designed around Friday-to-Friday market data generated after Friday’s market close and applied to the following trading week.
Update cadence: every Friday after market close
Time horizon: Friday → Friday
The formatted CSV/XLSX source file with data from 2019 to 2025 is included in this post, ready to download.
Step 1) Download the Quintile Risk Score File
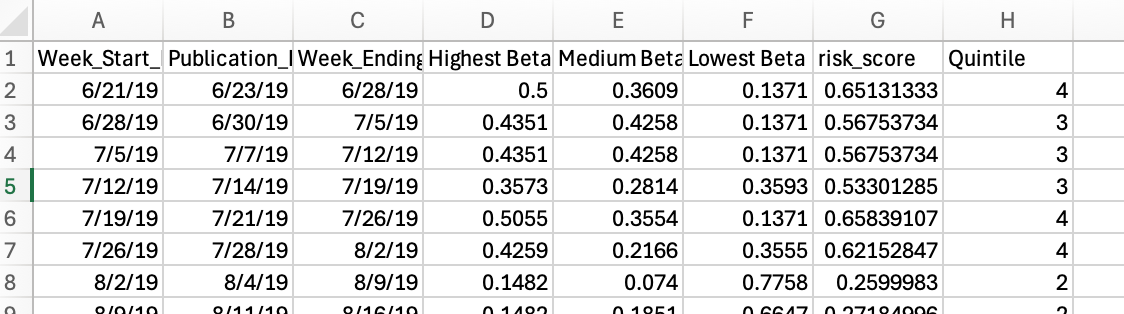
To get started, download the XLSX file. The allocations for Highest Beta, Medium Beta, and Lowest Beta are fractional weights that total approximately 1.00 each week (typically around 0.998).
Each quintile represents 20% of the overall scoring range: scores between 0.0–0.2 fall into Quintile 1, 0.2–0.4 into Quintile 2, and so forth. These scores describe the current market posture—moving from risk-off to risk-on as values rise. A score of 0 signals a fully risk-off environment, and 1 represents fully risk-on conditions.
Example format:
Step 2) Create free accounts
Tiingo offers a free tier that allows data pulls within a limited request rate. Posit Cloud also provides a free tier.
Tiingo: make a free account, grab your API Token from Account → API.
Posit Cloud: create a free account.
Step 3. Start a New Posit Cloud Project
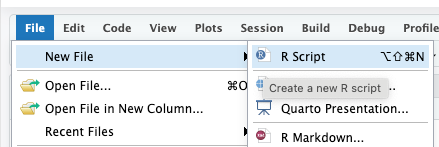
After creating both accounts, open Posit Cloud, create a new project, and add a new R script.
Log into Posit Cloud and create a new project (name it anything).
Add a new R Script—name it however you like.
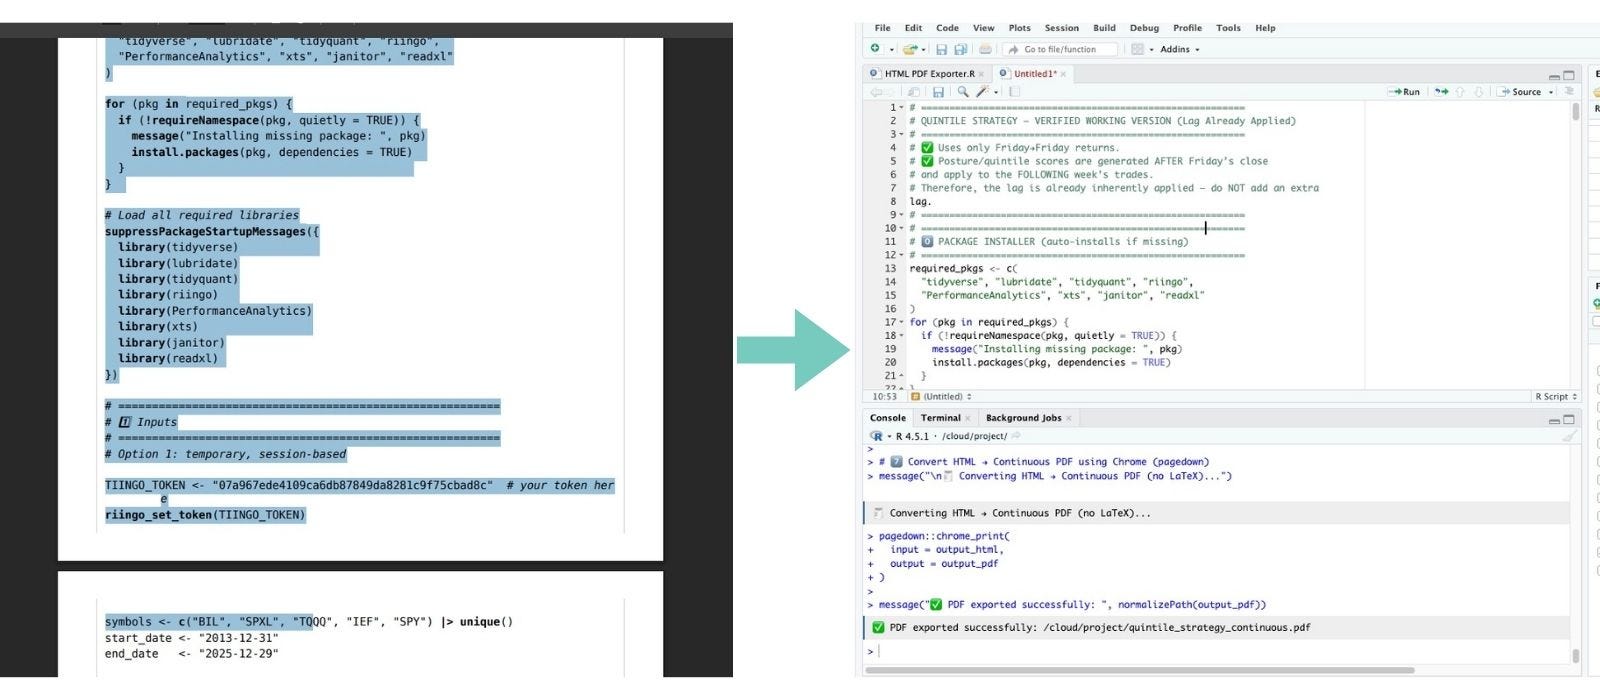
Copy and paste the code from the provided Quintile Strategy Continuous file or PDF.
Upload your posture_with_quintile.xlsx file into the same workspace.
Your R script will:
Load price data via Tiingo
Read the posture file (.xlsx or .csv)
Apply the quintile logic
Calculate performance and export visual results
Copy and paste the code from the provided PDF named “Quintile Strategy Continuous” to your workspace.
4. Install Packages Automatically
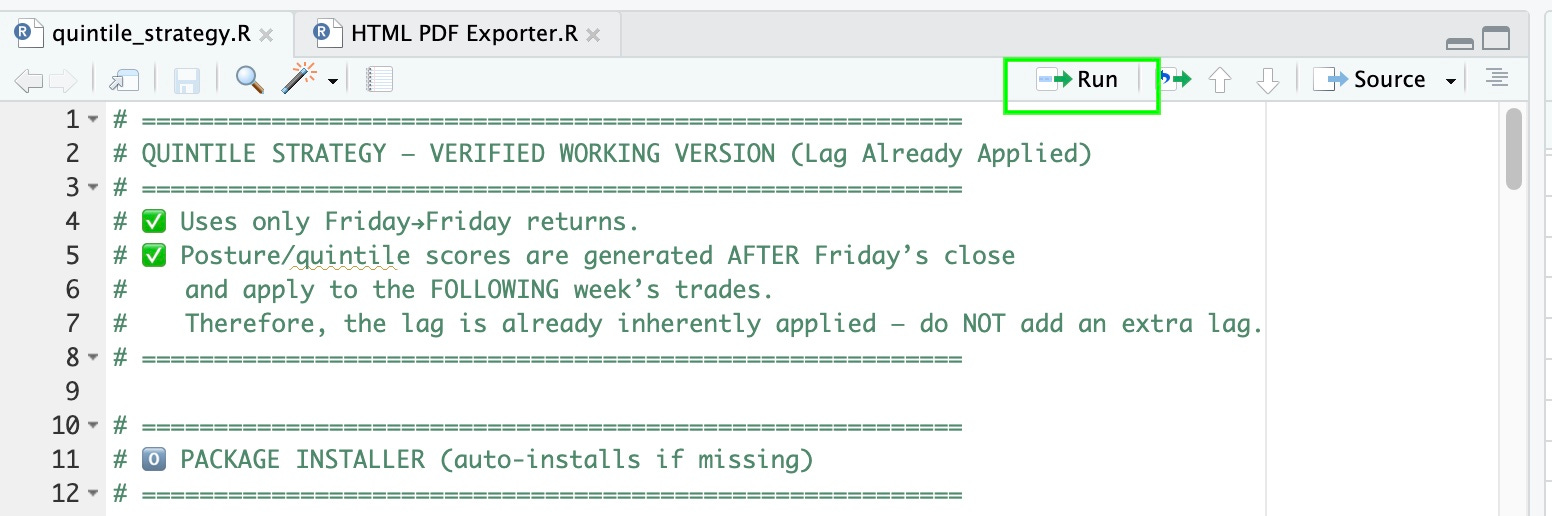
When you click “Run” in Posit Cloud (the green play button at the top of the script editor), the script automatically installs all required libraries. If a package isn’t already available in your session, it will install quietly before the rest of the code executes.
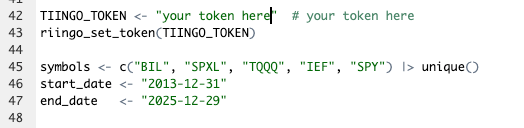
4) Add your Tiingo token
The first time you click “Run”, the script’s purpose is to install all the required libraries. Once the libraries are installed, paste your Tiingo token inside the quotation marks where indicated, then click “Run” again to load the data successfully.
This snippet:
Stores your token as an R variable (
TIINGO_TOKEN)Passes it to Tiingo’s API through the
riingopackageAllows all subsequent functions (like
riingo_prices()) to fetch data for your chosen ETFs
If you skip this step or paste your token incorrectly, R will return an error:
Tiingo msg) Invalid token header. No credentials provided.
That simply means the key isn’t being read correctly, just recheck your token and rerun the code block.
Define your data universe
Next, you’ll specify which ETFs you want to pull and the date range to cover:
symbols <- c(”BIL”, “SPXL”, “TQQQ”, “IEF”, “SPY”) |> unique()
start_date <- “2013-12-31”
end_date   <- “2025-12-29”
Breakdown:
BIL= short-term Treasuries (cash proxy)IEF= intermediate TreasuriesSPXL,TQQQ= leveraged equity ETFsSPY= benchmark for comparison
You can modify the start and end dates to shorten load times or test different market phases.
Understand the Quintile Algorithm
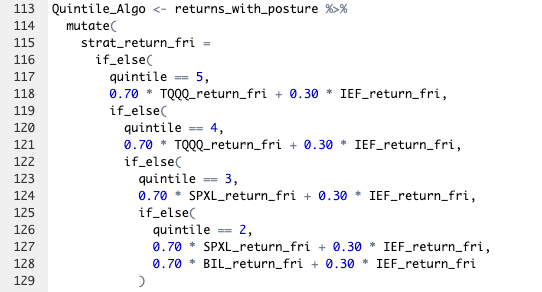
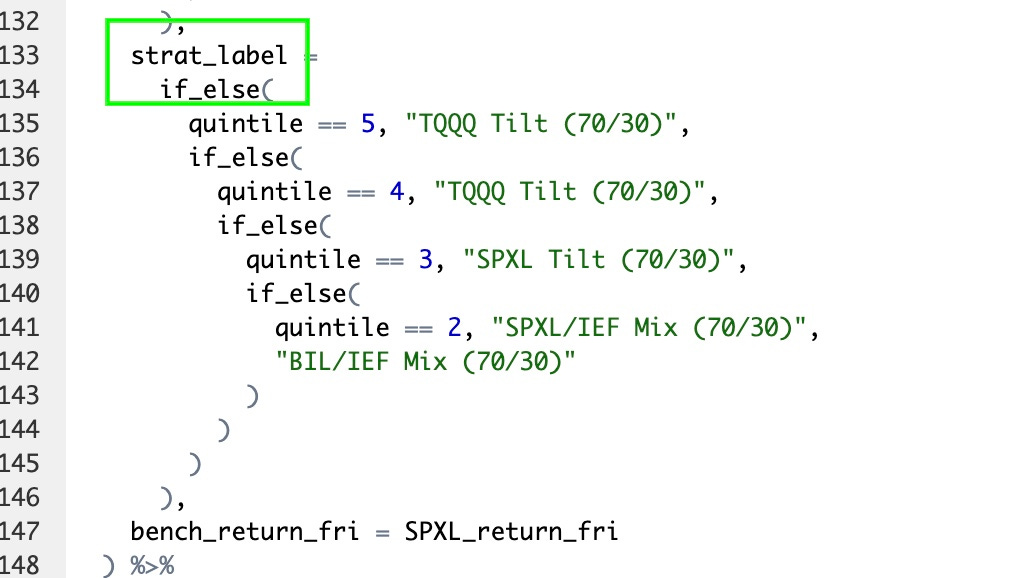
This basic algorithm is fairly straightforward. It reads the quintile value from the XLSX sheet and assigns the corresponding ETF returns for that week. The if-then logic is intentionally transparent—if not A, then B; if not B, then C, etc—making it easy to see exactly what’s happening inside the box.
Each quintile maps to a pre-defined asset mix, such as:
Quintile 1 → 70 % BIL + 30 % IEF
Quintile 5 → 70 % TQQQ + 30 % IEF
You can adjust these weights to experiment with different behaviors.
For example, changing Quintile 5 to 0.50*SPXL + 0.50*IEF will produce a new backtest trajectory.
If you change allocations, also update their labels for clarity in your results.
View Performance and Visuals
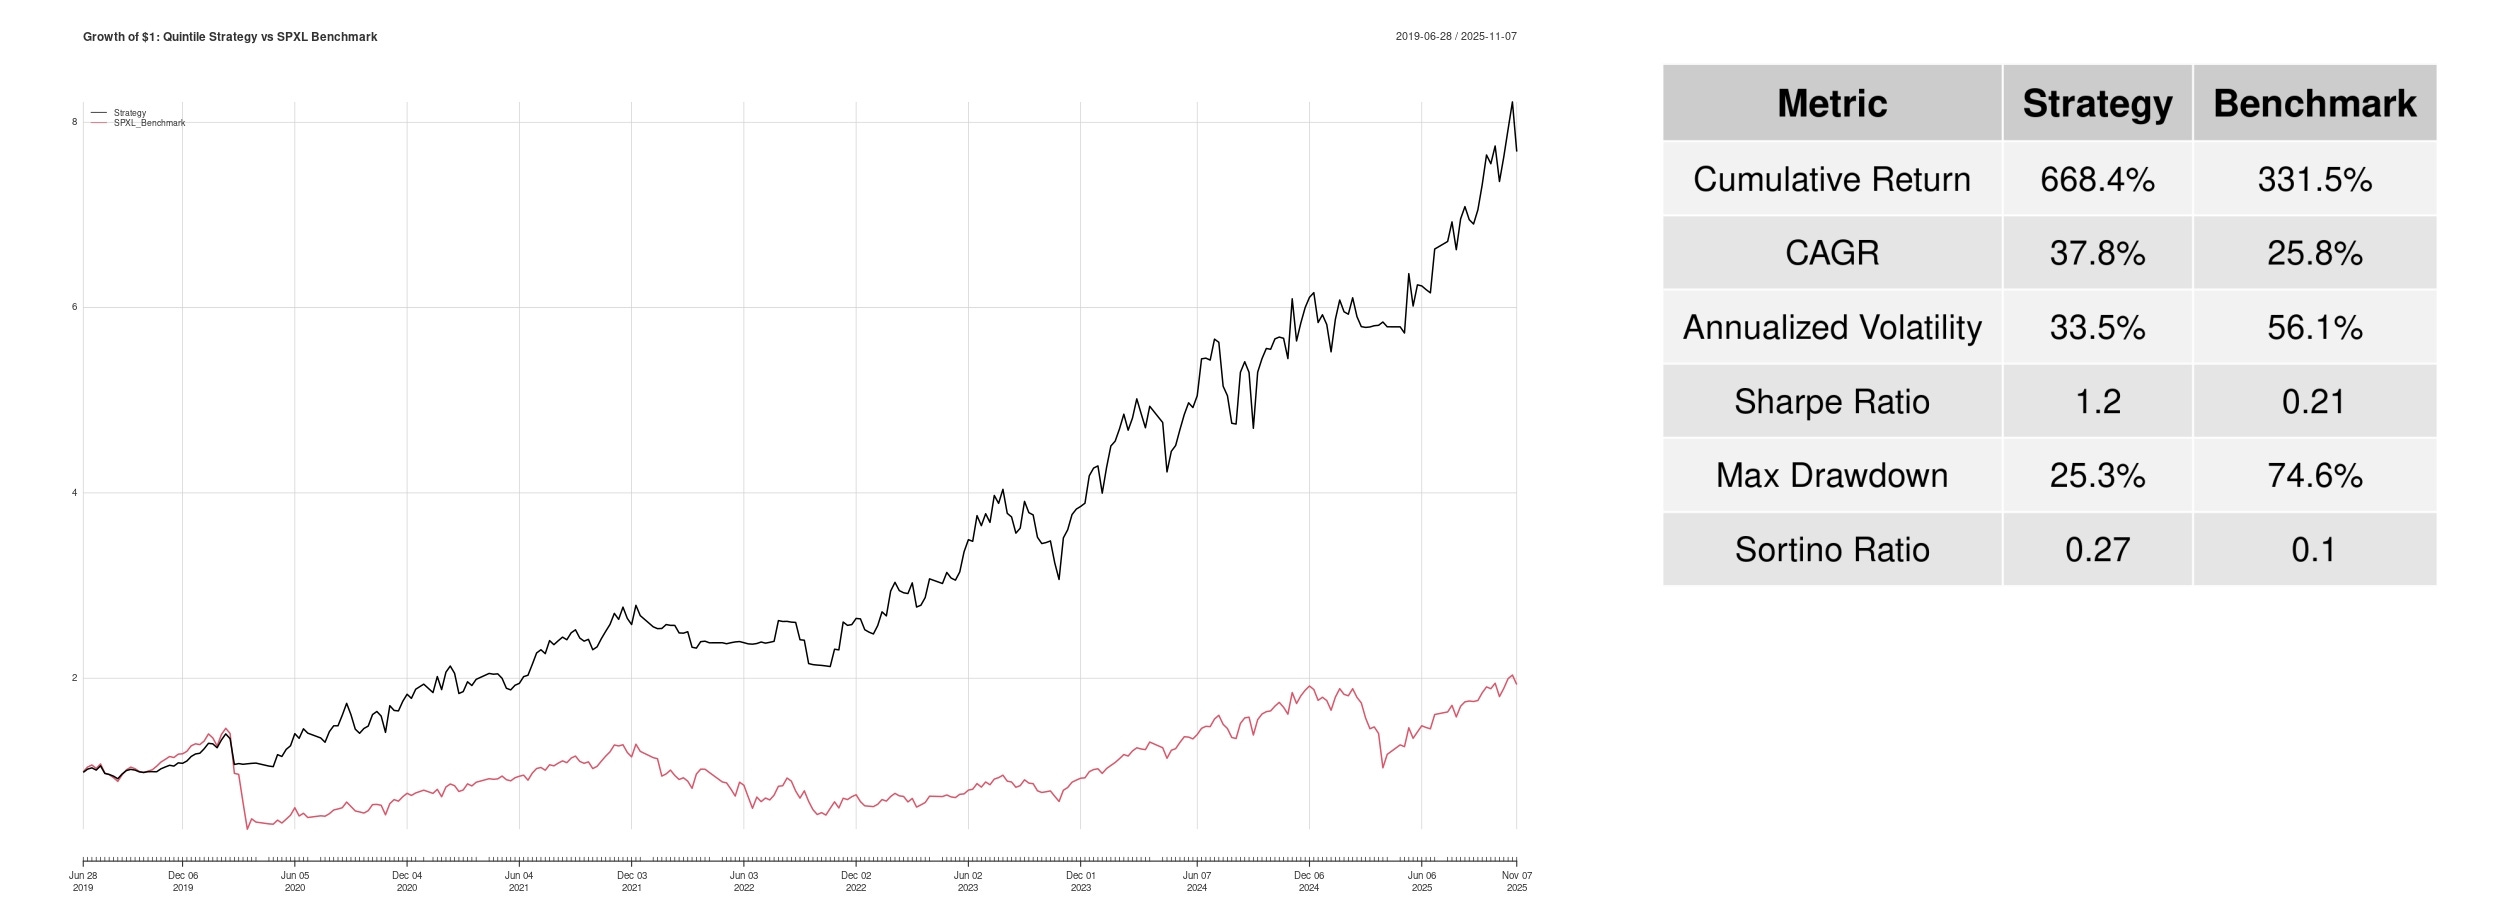
At the bottom of the script, you’ll find the Performance section. This is where the results are generated and saved. It automatically produces two JPEG files: a Growth of $1 chart and a Performance Table.
growth_of_dollar.jpg— shows cumulative growth of $1 (strategy vs. SPXL benchmark)performance_table_autosize.jpg— displays key stats like CAGR, volatility, Sharpe, and drawdown
Both are saved in your posit cloud for download or inclusion in reports.

You’re Done
You now have:
A working momentum-based quintile trading algorithm
Automated data download and allocation logic
A performance visualization and benchmark comparison
Full reproducibility aligned to the Risk Score’s Friday-to-Friday schedule
The Risk Score refreshes with each new data release. The Risk Score is your compass in that system, revealing when capital is shifting from risk-on to risk-off before prices fully react.
Happy building.
➡️ Save on an Annual Subscription»
Disclaimer: This material is for informational and educational purposes only and does not constitute financial, investment, or trading advice.
At last I have a performance table and graph. It took a while to get to this point, so I'll share my experience in case it helps others.
I pasted the code from the .pdf supplied into Posit Cloud then manually fixed the formatting. Then used Grok to fix my errors and remove the hidden formatting codes from Adobe (The codes I knew nothing about).
The R code now ran, but I couldn't see any output. According to Grok, Posit Cloud free version blocks the output, so I installed the RStudio Desktop. A few more error messages, screen shots, Grok dialog and I'm there.
I'm a retired, non programmer, so if I can get this far, anyone can. Good luck!
Being a total novice to this sort of thing it seems a bit intimidating but the instructions are detailed and hopefully I will be able to complete the task. Thanks for providing this.