Q72 Weekly Data Release
June 30–July 4, 2025: The Q72 Weekly Data Release delivers data, week in, week out. Paid readers get the edge every Sunday.
Why Q72 Tracks the Business Cycle
Last week, we spent days building, then we released the first version of our Business Cycle Composite Score.
Like any good system builder, we got ahead of ourselves—tried to plug it straight into the next version of the Stratum Index.
But even a clean macro rotation can’t match the depth and adaptability of the Stratum Index.
The Business Cycle Composite Score works for what it’s designed to do: measure market conditions objectively.
The Business Cycle Composite Score is simple: each week, we evaluate 12 key macro spreads—cyclicals vs defensives, Treasuries vs high yield, TIPS vs cash—and assign a +1, 0, or −1. Add them up, and you get a pressure gauge.
And here’s the point:
If you’re trying to predict the lightning strike, you’re already too late.
But if you track the clouds, the wind, the pressure drop—you see the storm building.
That’s what the composite cycle score does.
It doesn’t tell you when the crash hits. It tells you when conditions are turning.
The 2022 Russian Invasion: The Setup vs. The Catalyst
Most people think the market dropped in 2022 because of the invasion.
“Russia invaded. Stocks dropped.”
But that’s not how markets really work. Selling needs a reason, yes—but it also needs conditions.
Like weather, a storm doesn’t begin with lightning—it begins with pressure.
2022 Composite Score: The Underlying Risk
Think of the Business Cycle Composite Score as a barometer, not a crystal ball.
This score blends return spreads, credit stress, and inflation proxies into a single number. The 8-week average (navy line) shows market tone.
Above +4 = Expansion bias
Below −4 = Contraction pressure
By early 2022, the score had dropped 10 full points—well before the tanks rolled in.
Key Dates:
3/17/2021: Fed begins hiking rates
2/22/2022: Russia invades Ukraine
10/12/2022: SPY bottoms out
If each point reflects an academically backed macro condition, then a 10-point drop means many signals had already turned. The pressure was building long before the spark.
And in reverse, calling the bottom requires the same pattern—multiple indicators flipping positive, and holding, over several weeks.
Price Action: The Visible Outcome
Now look at the actual SPY price chart:
Key Dates:
3/17/2021: Fed begins hiking rates
2/22/2022: Russia invades Ukraine
10/12/2022: SPY bottoms out

The invasion wasn’t the start of the 20 some percent drop. The Invasion was was the spark in a dry forest.
The conditions were already in place—weeks, even months, before the war.
By the time the war started, our models had already shifted into Defensive posture.
The shift wasn’t instant or perfect—each algorithm operates on its own clock. But that’s the point:
This wasn’t about predicting the invasion. It was about spotting the pressure building beneath the surface.
Rising rates
Inflation
Widening credit spreads
Liquidity stress
By the time tanks rolled in, the selloff was already in motion.
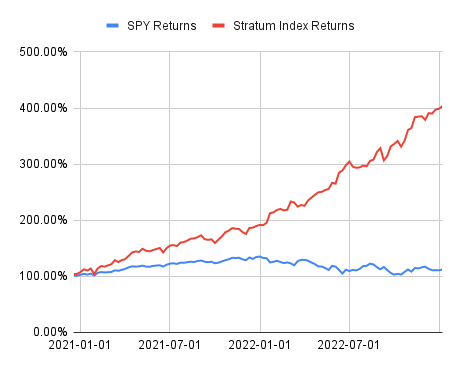
We didn’t start live trading the Stratum Index until 2025—because the model wasn’t ready. But if it had been, here’s what the results could’ve looked like.
The Stratum Index is not perfect. But in 2022, one stat says it all: +108.6%.
While the S&P 500 fell −16.6%, the Stratum Index surged.
Not because it predicted the headlines—but because it followed the weather patterns.
That Said...
The Stratum Index doesn’t beat SPY every week.
When markets chop instead of trend, momentum models like ours don’t shine.
The good news? Momentum has worked for centuries—and it’s not going anywhere.
And when the floor drops out?
That’s when the Stratum tends to deliver its best.
Note: The results shown reflect modeled trades based on Stratum Index allocations. Individual results may vary with execution, fees, and capital allocation.
This Week’s Takeaway
At Q72, we don’t front-run the news.
We track the pressure. We watch the weather. And we move before the crowd.
Paid subscribers get full access to the signals, context, and positioning each Sunday—before the week begins.
Want the edge?
This Sunday’s report shows exactly how we’re reading the current storm.
Business Cycle Commentary
Risk is back on—but does the market believe it? Tech, chips, and discretionary all surged this week, but the model still favors Utilities, Gold, and Treasuries. That disconnect isn’t a bug—it’s a feature of this regime: aggressive price action sitting on fragile macro footing. Sector flows suggest an expansion narrative, but capital allocation tells a different story.
Keep reading with a 7-day free trial
Subscribe to Quanta 72 to keep reading this post and get 7 days of free access to the full post archives.


