
Avoiding SPY Drawdowns With Currency ETFs
Can FX Relative Strength Improve Weekly Equity Timing?

Markets do not move in stories, they move in phenomena. Price, volatility, momentum, drawdowns, these are observable facts. They can be measured, recorded, stress-tested. The error begins when explanation is mistaken for truth. A persuasive narrative about why the market moved is often just a polished description of the surface.
Crashes follow patterns as well. Volatility clusters. Funding conditions tighten. Assets reprice in synchrony, like instruments snapping to the same discordant note. The ultimate cause may remain obscured, yet the pattern itself is visible and quantifiable.
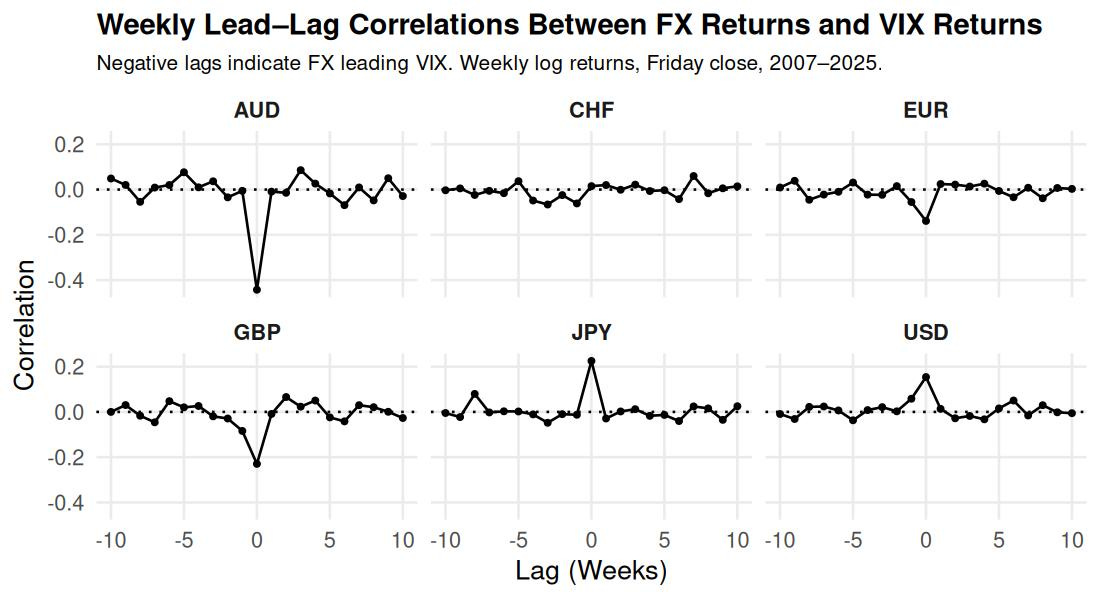
In earlier work, I examined whether major currency ETFs lead U.S. equity volatility. The popular assumption is that foreign exchange markets act as an early warning system for the VIX. The data does not support that belief. There is no consistent predictive edge from currencies into forward volatility.
What does persist, across nearly two decades of daily and weekly observations, is something subtler. Same-day currency returns align with same-day volatility regimes in a statistically durable way. That is notable. Foreign exchange and equity derivatives occupy structurally different domains. One would not expect a stable rhythm between them. Yet a rhythm appears.
When two seemingly independent systems move together in a measurable cadence, the anomaly becomes information. Information that survives twenty years of data is unlikely to be random noise. It suggests structure.
This raises a natural question. If currencies express shifts in global risk appetite, could their short-term relative strength provide a disciplined framework for equity timing?
Methodology: Can Currency ETFs Help Avoid Market Crashes?
To test whether currency leadership can act as a structural risk filter, I examined six developed-market currency ETFs:
UUP — U.S. Dollar
FXY — Japanese Yen
FXE — Euro
FXF — Swiss Franc
FXA — Australian Dollar
FXB — British Pound
Because direction matters, A > B is not the same as B > A. With six currencies, the possible combinations are simple:
6 choices for the first position.
5 remaining for the second.
6 × 5 = 30 ordered pairs.
Each ordered pair follows a the same dual momentum rules:
If Currency A’s 4-week return is greater than Currency B’s 4-week return → hold SPY for the next week.
If Currency A’s 4-week return is less than or equal to Currency B’s 4-week return → allocate to Treasury bills for the next week.
Rebalance Frequency: Reevaluate and update the allocation weekly.
Why Dual Momentum?
Dual momentum exploits relative performance between pairs of assets, not absolute direction alone. It asks a comparative question, which asset is stronger right now?
That idea sits comfortably within the broader asset pricing framework.
Instead of asking whether an asset beats cash in isolation, Dual Momentum compares assets against one another. The signal is not “is the market up?” It is “which asset is stronger relative to its alternative?”
Walk-Forward Framework
To reduce overfitting and limit the risk of data-mined results, each strategy was evaluated using a walk-forward split.
The sample was divided into two distinct periods:
In-sample: 2007–2015
Out-of-sample: 2016–2024
Each rule was first ranked using only the in-sample period. The same rule was then applied, unchanged, to the out-of-sample period. No re-optimization.
Top In-Sample (2007–2015) vs Out-of-Sample (2016–2024)
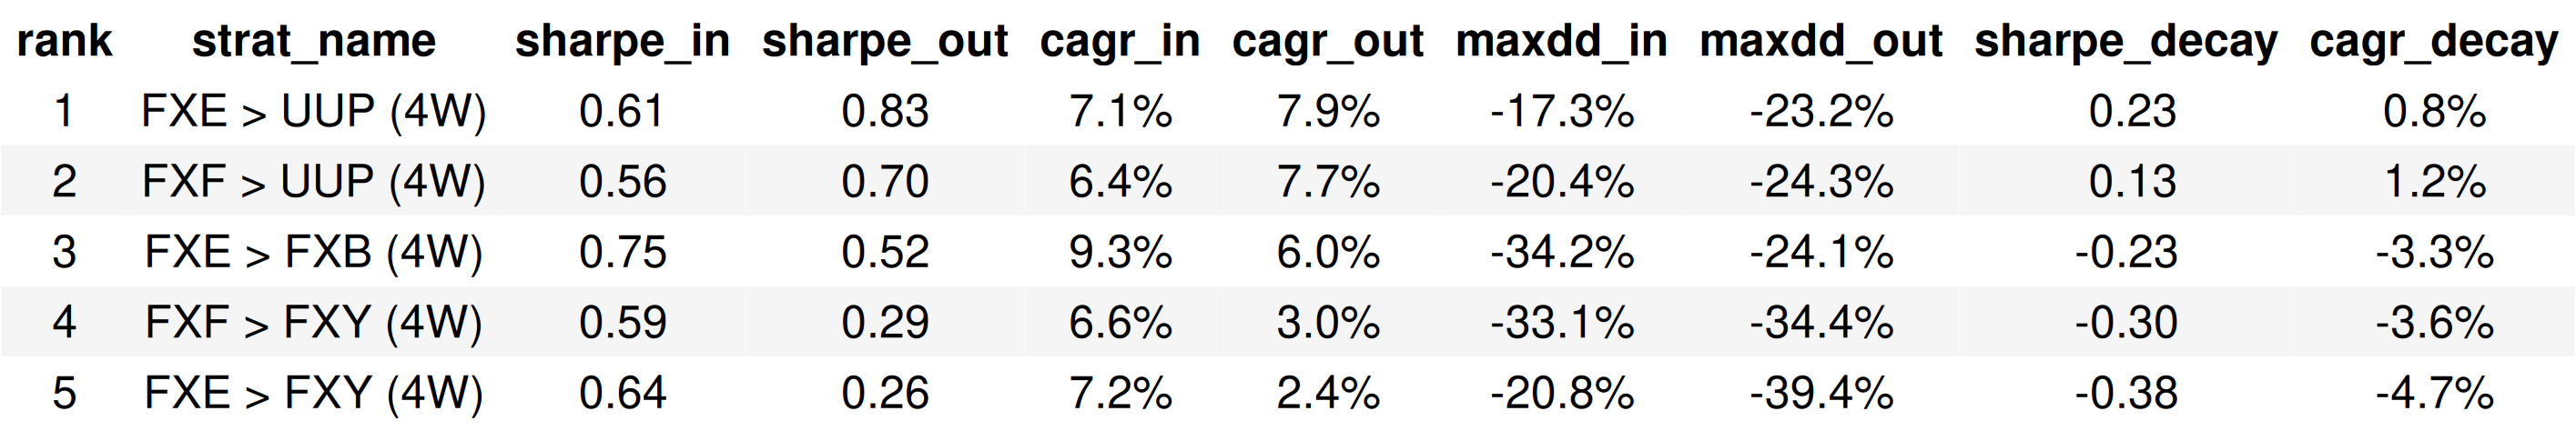
A few currency rules held up out of sample, two that stick out:
FXE > UUP
FXF > UUP
Both rules compare major European currencies, the Euro and the Swiss franc, against the U.S. dollar.
That consistency is unlikely to be accidental. The dollar sits at the core of global funding markets. When European currencies strengthen relative to it, dollar demand often softens. Funding pressure eases. Liquidity conditions can stabilize. Equity environments tend to become less fragile.
The pattern is economically coherent because it reflects shifts in cross-border capital flows. It also aligns with established domain knowledge about how the financial system transmits stress.
Anomaly 1: FXE (Euro) vs UUP (U.S. Dollar)
This chart compares the euro (FXE — Invesco CurrencyShares Euro Trust) against the U.S. dollar (UUP — Invesco DB US Dollar Index Bullish Fund).
When FXE > UUP over a trailing four-week window, hold SPY for the next week.
If that condition is not met, allocate to BIL (Cash).
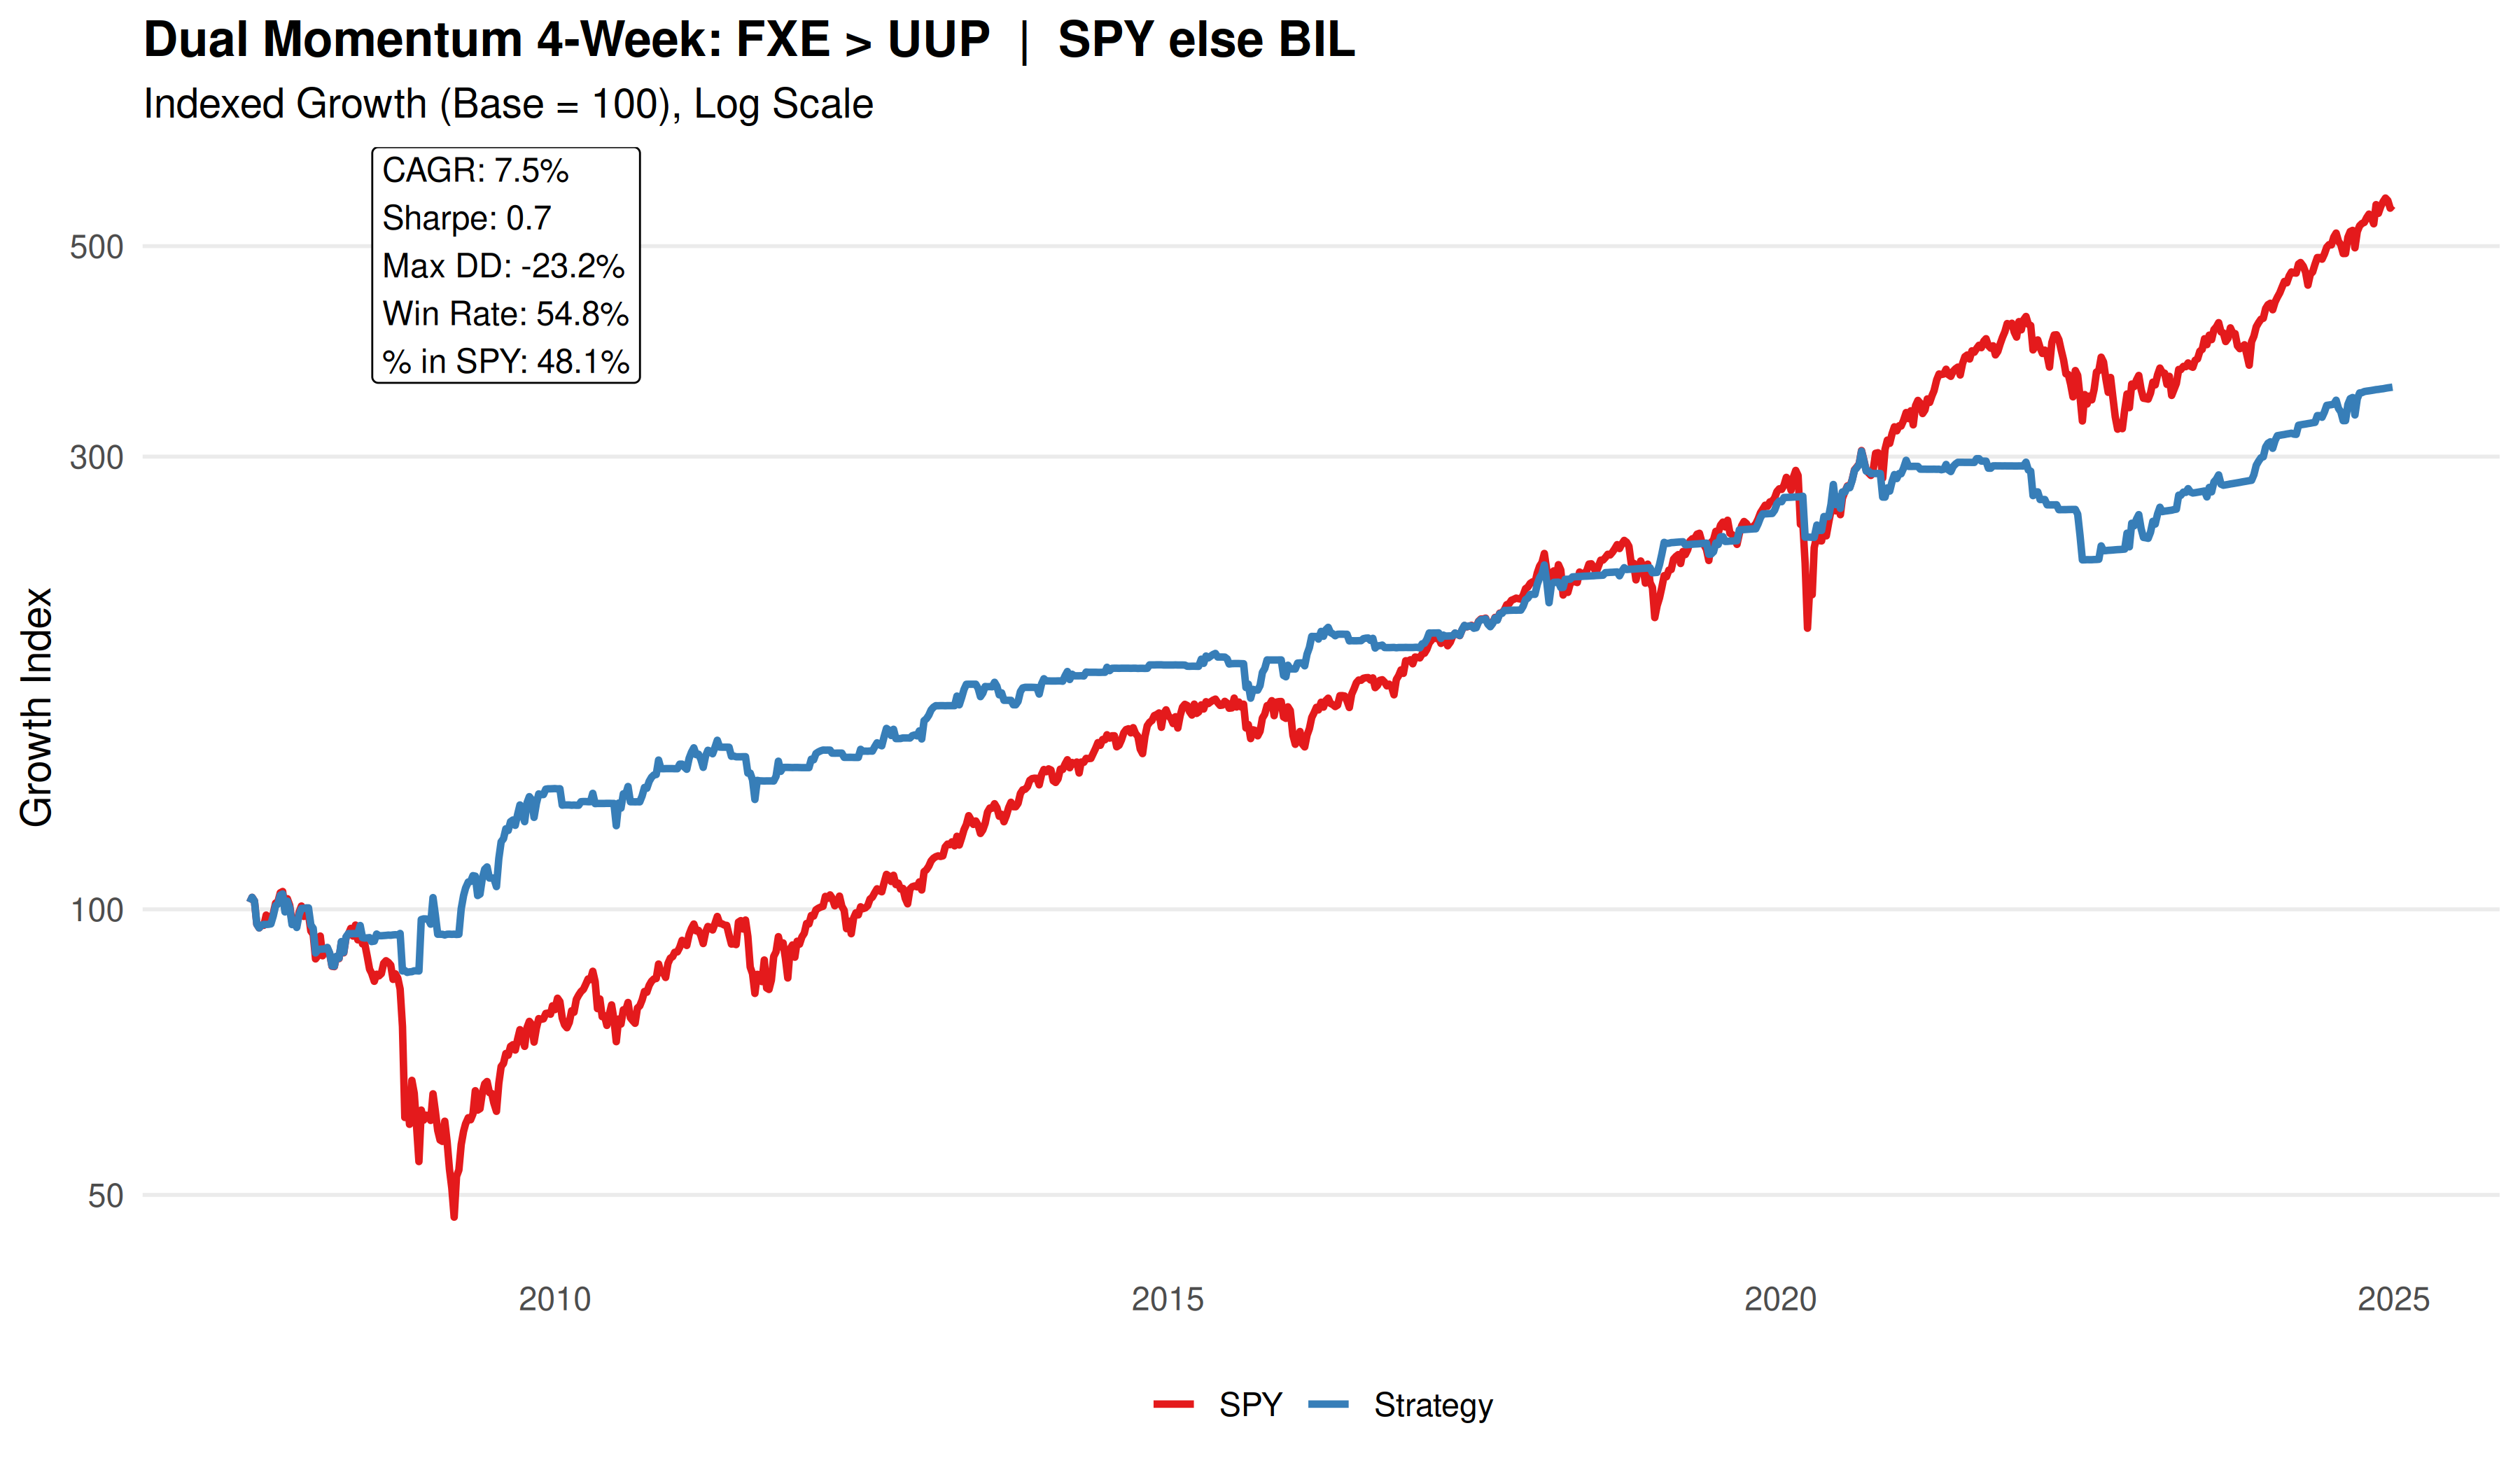
Since 2008, this framework has avoided the deepest structural drawdowns, not all of them, but enough to materially reshape the path of returns. The long-term profile is instructive:
CAGR: 7.5%
Sharpe Ratio: 0.7
Max Drawdown: 23.2%
Win Rate: 54.8%
The euro represents the largest developed currency bloc outside the United States. It reflects European growth expectations, banking stability, and cross-border capital flows. The dollar, by contrast, functions as the world’s reserve currency and primary funding unit.
When FXE strengthens relative to UUP over a short window, it often signals easing dollar demand. That shift can reflect improving global liquidity conditions and reduced funding stress. In many historical episodes, such periods have aligned with more constructive equity environments.
When the dollar dominates instead, it frequently coincides with tighter conditions. Dollar strength can accompany deleveraging, capital repatriation, or defensive positioning.
Anomaly 2: FXF (Swiss Franc) vs UUP (U.S. Dollar)
This chart compares the Swiss franc (FXF — Invesco CurrencyShares Swiss Franc Trust) to the U.S. dollar (UUP — Invesco DB US Dollar Index Bullish Fund).
Switzerland occupies a unique position in global finance. The franc has long been viewed as a stability currency, supported by strong fiscal balances and a historically conservative banking system. Yet it remains deeply integrated into European capital markets.
When FXF > UUP over a trailing four-week window, hold SPY for the following week.
If that condition fails, rotate into BIL (Cash).
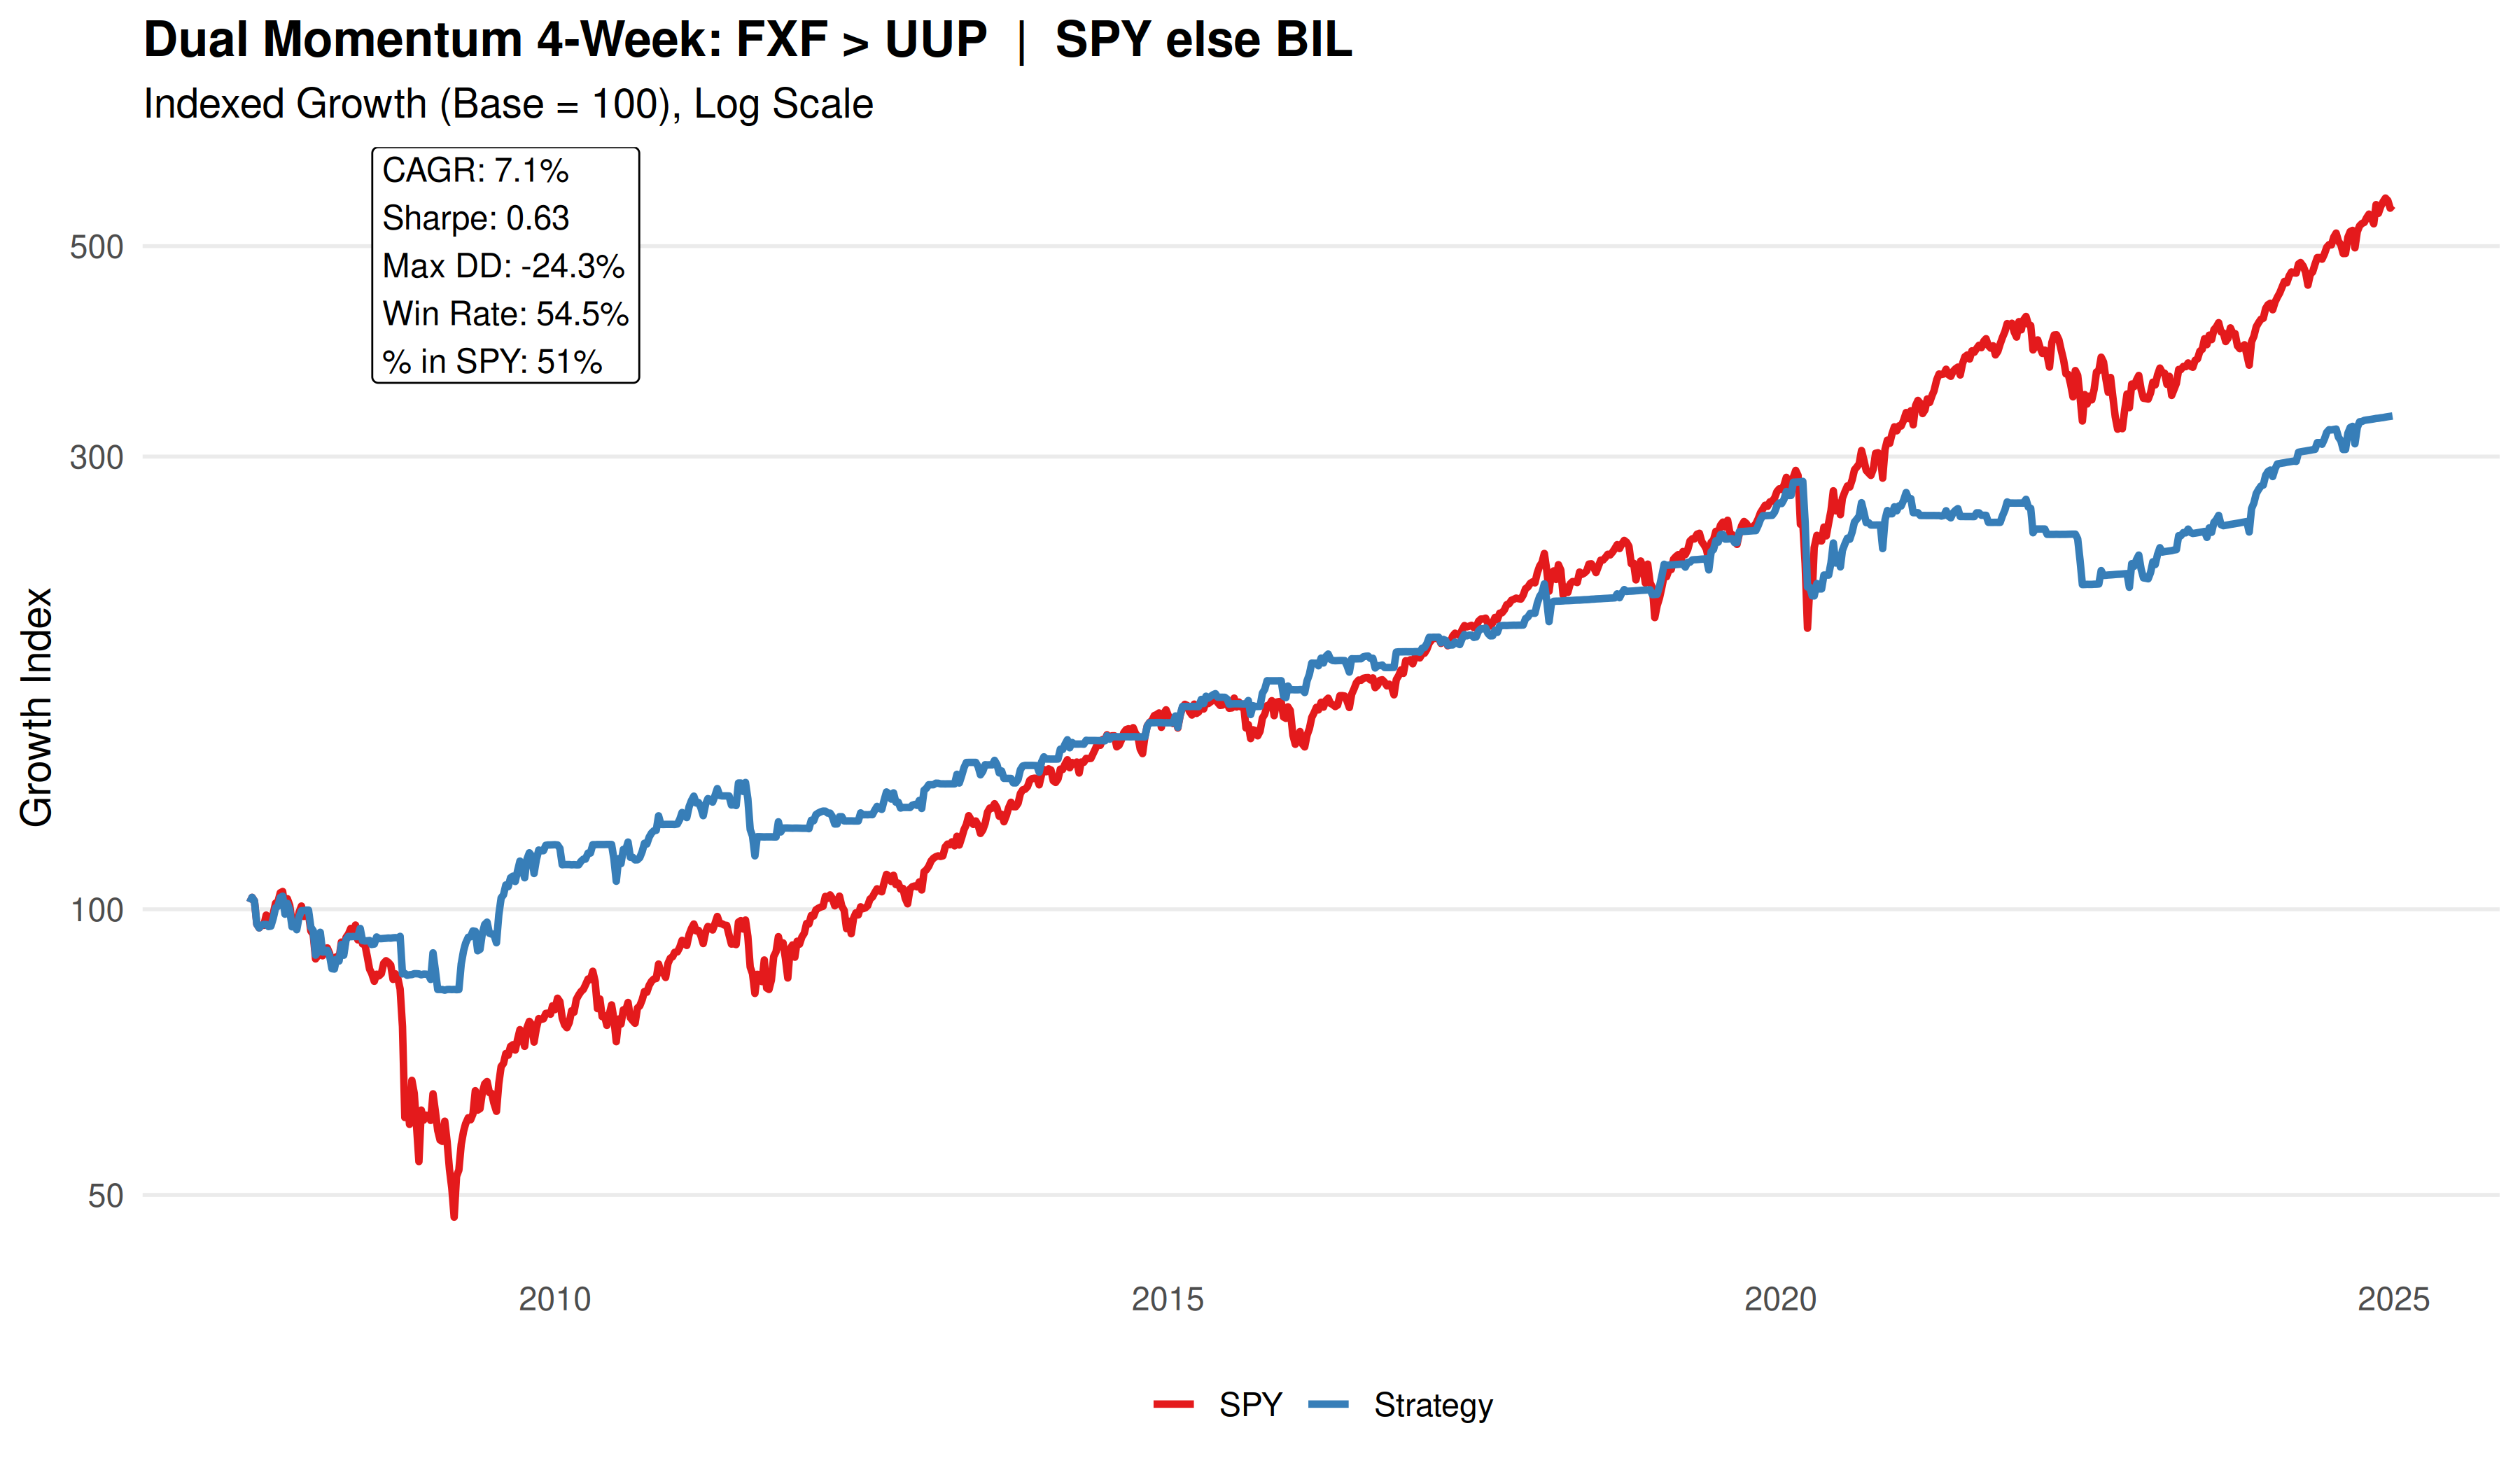
Since 2008, this rule has sidestepped the deepest structural damage, not perfectly, yet consistently enough to alter the compounding path in meaningful ways.
The long-term profile:
CAGR: 7.1%
Sharpe Ratio: 0.62
Max Drawdown: 24.23%
Win Rate: 54.5%
When FXF strengthens relative to UUP, the move can signal a shift in global capital allocation away from concentrated dollar demand. In certain regimes, that relative franc strength has coincided with steadier global participation in risk assets.
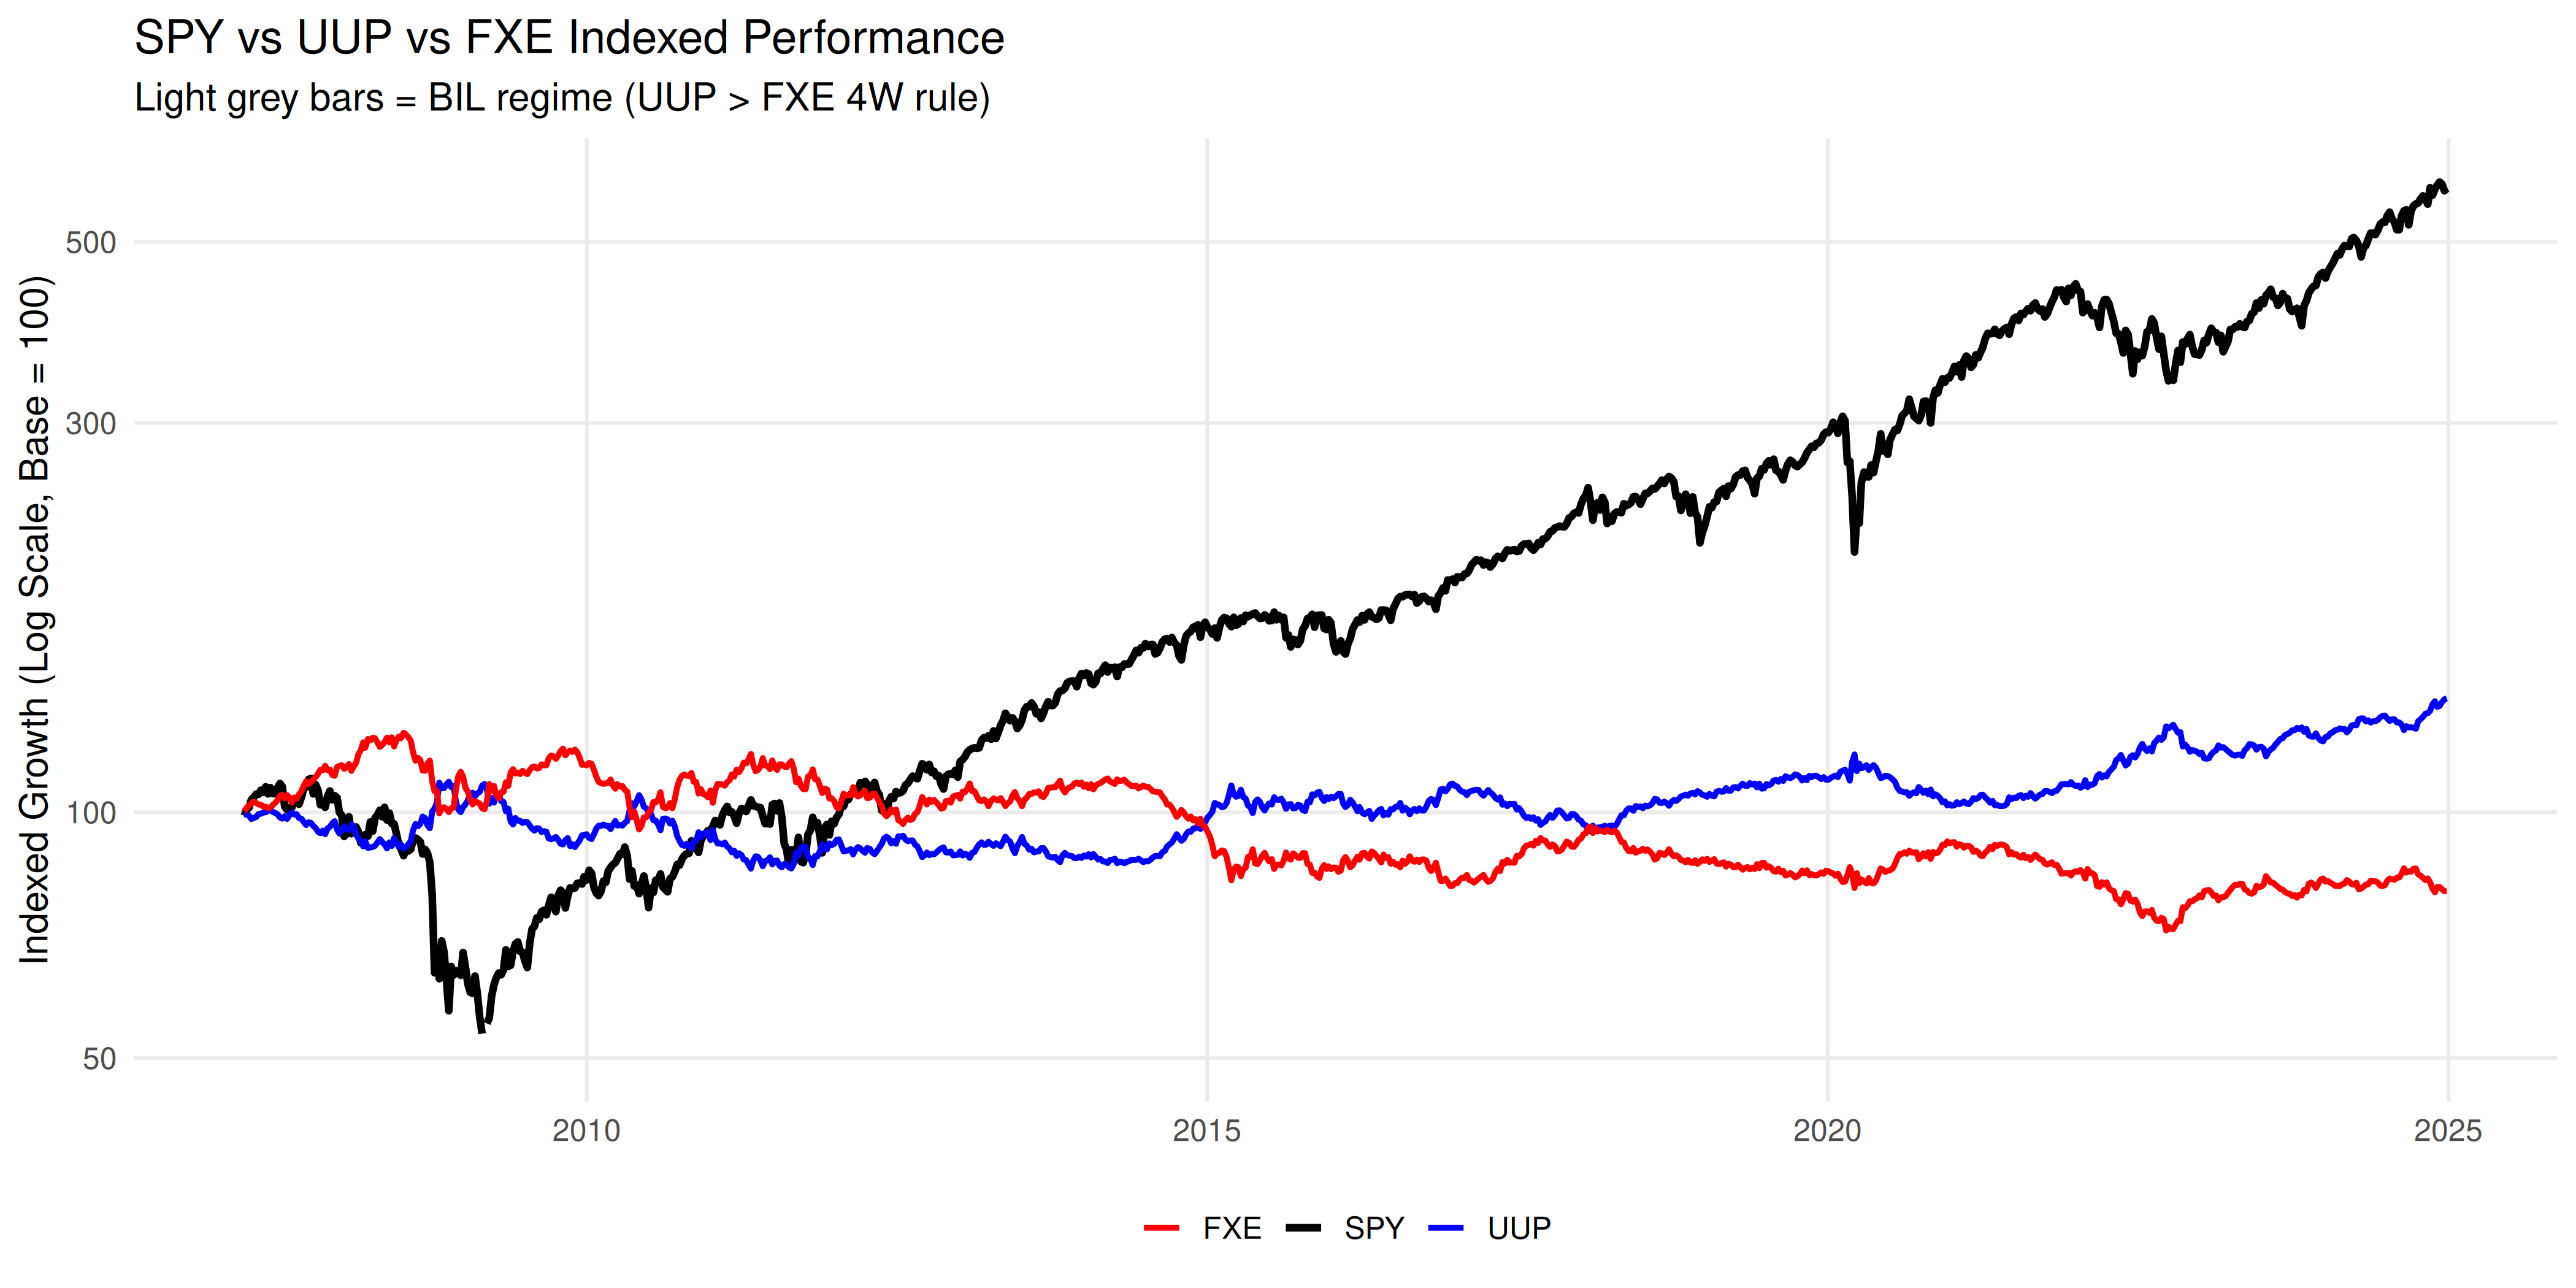
What the Long-Term FXE > UUP Interaction Shows
Placed on the same log-scale canvas, SPY compounds powerfully upward over time. UUP oscillates in cycles of strength and retracement. FXE shows the mirror image, early strength followed by structural decline versus the dollar.
During the 2008 crisis, SPY collapses. UUP rises. FXE falls. Capital compresses inward toward dollar liquidity.
What the FXE > UUP Return Distribution Reveals
The chart below splits weekly SPY returns into two currency-defined regimes:
Risk-On: FXE > UUP
Risk-Off: UUP > FXE
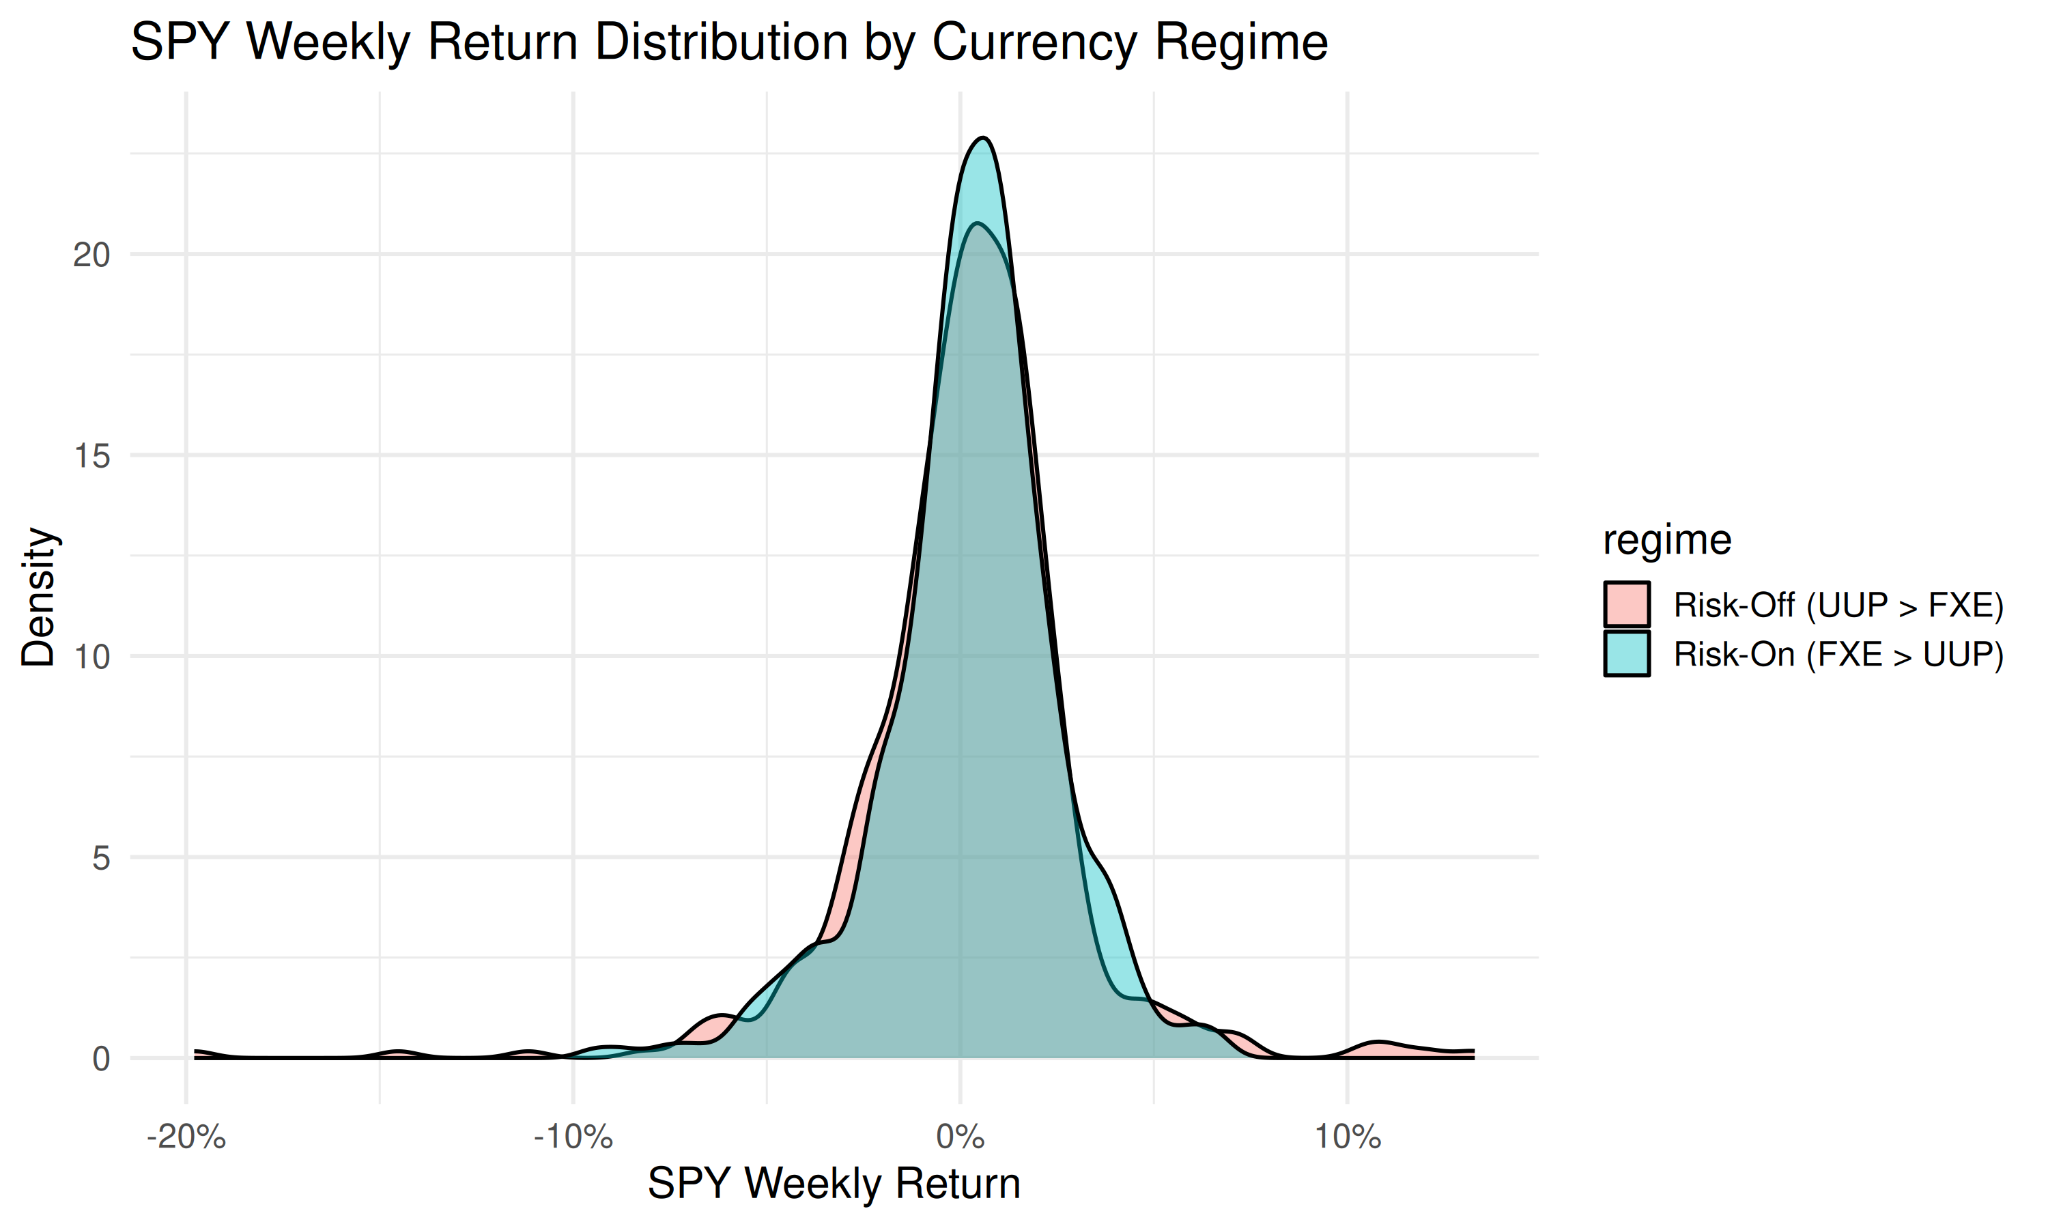
Both regimes resemble a normal distribution. Markets remain probabilistic. Nothing magical appears.
But the shapes are not identical.
In the Risk-On regime, the curve is slightly taller and more concentrated around modest positive returns.
In the Risk-Off regime, the curve flattens. The negative tail thickens. Extreme downside weeks become more common.
What This Actually Demonstrates
Dual momentum does not succeed because it predicts the next step in a neat causal chain. It is not a Markov map of market transitions. It works because it tracks a persistent, observable phenomenon. It measures behavior without pretending to fully explain it.
Markets can reveal stress and expansion through relative strength. Capital rotates before headlines adjust. Dual momentum simply follows that rotation.
The broader currency ETF exercise reinforces this point.
Macro currency leadership can inform the probability landscape of equities.
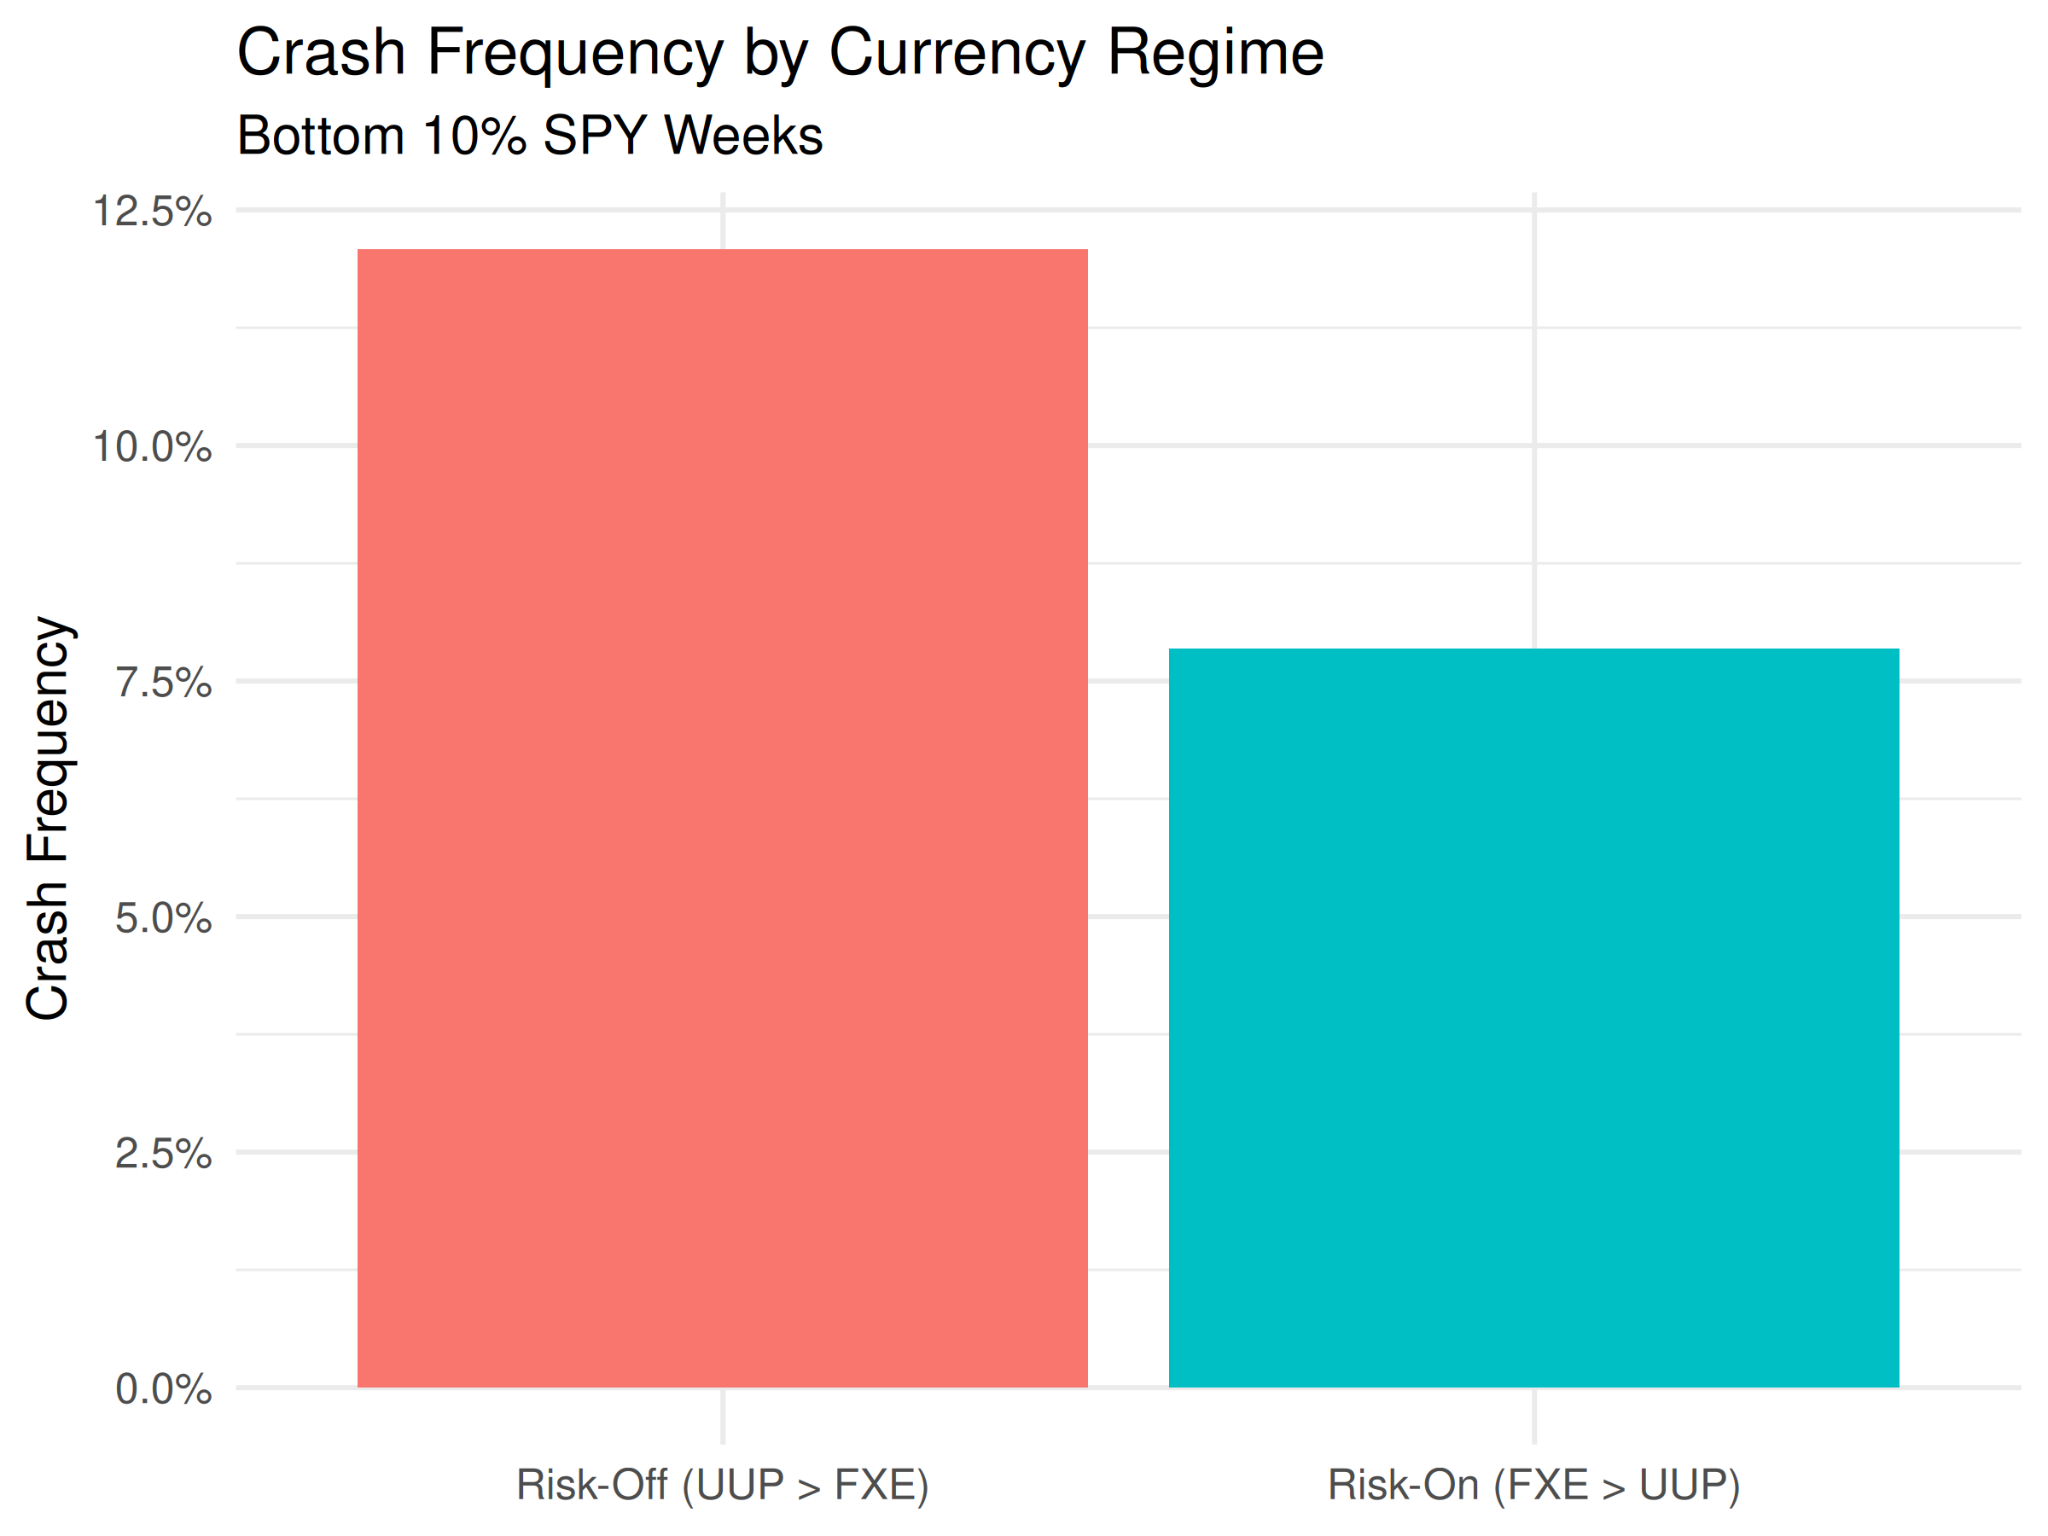
When FXE leads UUP, capital flows outward, dollar pressure eases, liquidity stabilizes. Equity returns compress toward modest gains, and crash frequency declines.
When UUP leads FXE, liquidity tightens. Defensive positioning rises. Dispersion widens. Downside tails grow heavier.
Rotation, structure, and behavioral signals are our edge in a market gripped by reflex.
📉 2018 Volmageddon — Shifted into bonds and gold
🦠 2020 COVID Crash — Early defense
🏦 2022 Rate Cycle — Avoided tech collapse
🔁 2024 Reflation — Led SPY back into offense
Learn about the Stratum Index »
Disclaimer: This material is for informational and educational purposes only and does not constitute investment advice. Past performance does not guarantee future results. All strategies involve risk, including the potential loss of principal. Always conduct your own research or consult a qualified financial professional before making investment decisions.
Will this become part of your Quintile calculation going forward?
Interesting article and nice work :)