
Do Candlestick Patterns Work? A Backtest of 24 Patterns Across 5,000 Stocks
This study tests 24 candlestick patterns across the full NYSE universe over 10 years, controlling for trend and regime.

Today, candlestick patterns are often presented as settled technical truth, said to forecast reversals and continuation. Yet when traders attempt to encode these ideas into systematic strategies, the results rarely survive out-of-sample testing.
I posted an early version of this study on Reddit, and someone asked a fair question:
“Are you actually going to test every ticker?”
The answer was yes.
This post documents what happens when candlestick patterns are tested across the full NYSE universe of tickers in the last ten years, broken down by day.
Read the earlier version here»
The criticism I agreed with from the start
Whenever candlestick patterns come up, the same objection appears: they do not predict anything on their own. That objection is correct.
The core problem is structural. Candlesticks do not appear only at extremes. They form everywhere, across uptrends, downtrends, ranges, and noise. The candle itself is nothing more than a compact visual summary of OHLCV for a single session. Traded in isolation, its shape has no statistically meaningful effect on what happens next. This result has been shown repeatedly.
The confusion comes from how the question is usually framed.
When people ask whether candlestick patterns “work,” they are often asking whether these visual formations contain information by themselves, independent of discretion, interpretation, or supporting structure. Once phrased that way, the answer is straightforward: they do not.
This candlestick study asks a specific follow-on question: do candlestick patterns add information once context is already defined?
In practical terms, that means asking whether candlesticks contribute anything beyond what a simple, well-understood trend filter already provides. The reference point here is the 20/50 simple moving average and a 5 day trend filter.
We can confidently say that SMAs work.
The question, then, is not whether candlesticks can be made to look useful in hindsight, but whether adding candlestick patterns to an existing trend framework improves outcomes in any measurable way.
This study attempts to test that directly.
The universe and the data
I began with 123,065 supported tickers across global exchanges, including the NYSE, NASDAQ, OTC markets, Pink Sheets, and Hong Kong. The raw universe included everything: active stocks and ETFs, delisted symbols, bankrupt companies, and short-lived corporate entities.
From there, I cleaned aggressively:
Deduplicated reused symbols
Removed inactive placeholders
Filtered to common stocks and ETFs with valid price histories
Each remaining ticker had to trade at some point during the 10 year study window. Longevity did not matter. Participation did.
After filtering, the final universe contained 5,909 tickers. I excluded SPACs, warrants, and non-standard securities to reduce classification noise.
This approach avoids survivorship bias and preserves the full market lifecycle.
Across this universe, I tested 24 candlestick patterns, producing a dataset large enough to strain my cloud environment.
QA sample: Randomly selected real OHLC examples of 12 tested candlestick pattern are included for visual verification of pattern definitions only. These examples are uncurated and not selected based on outcomes.
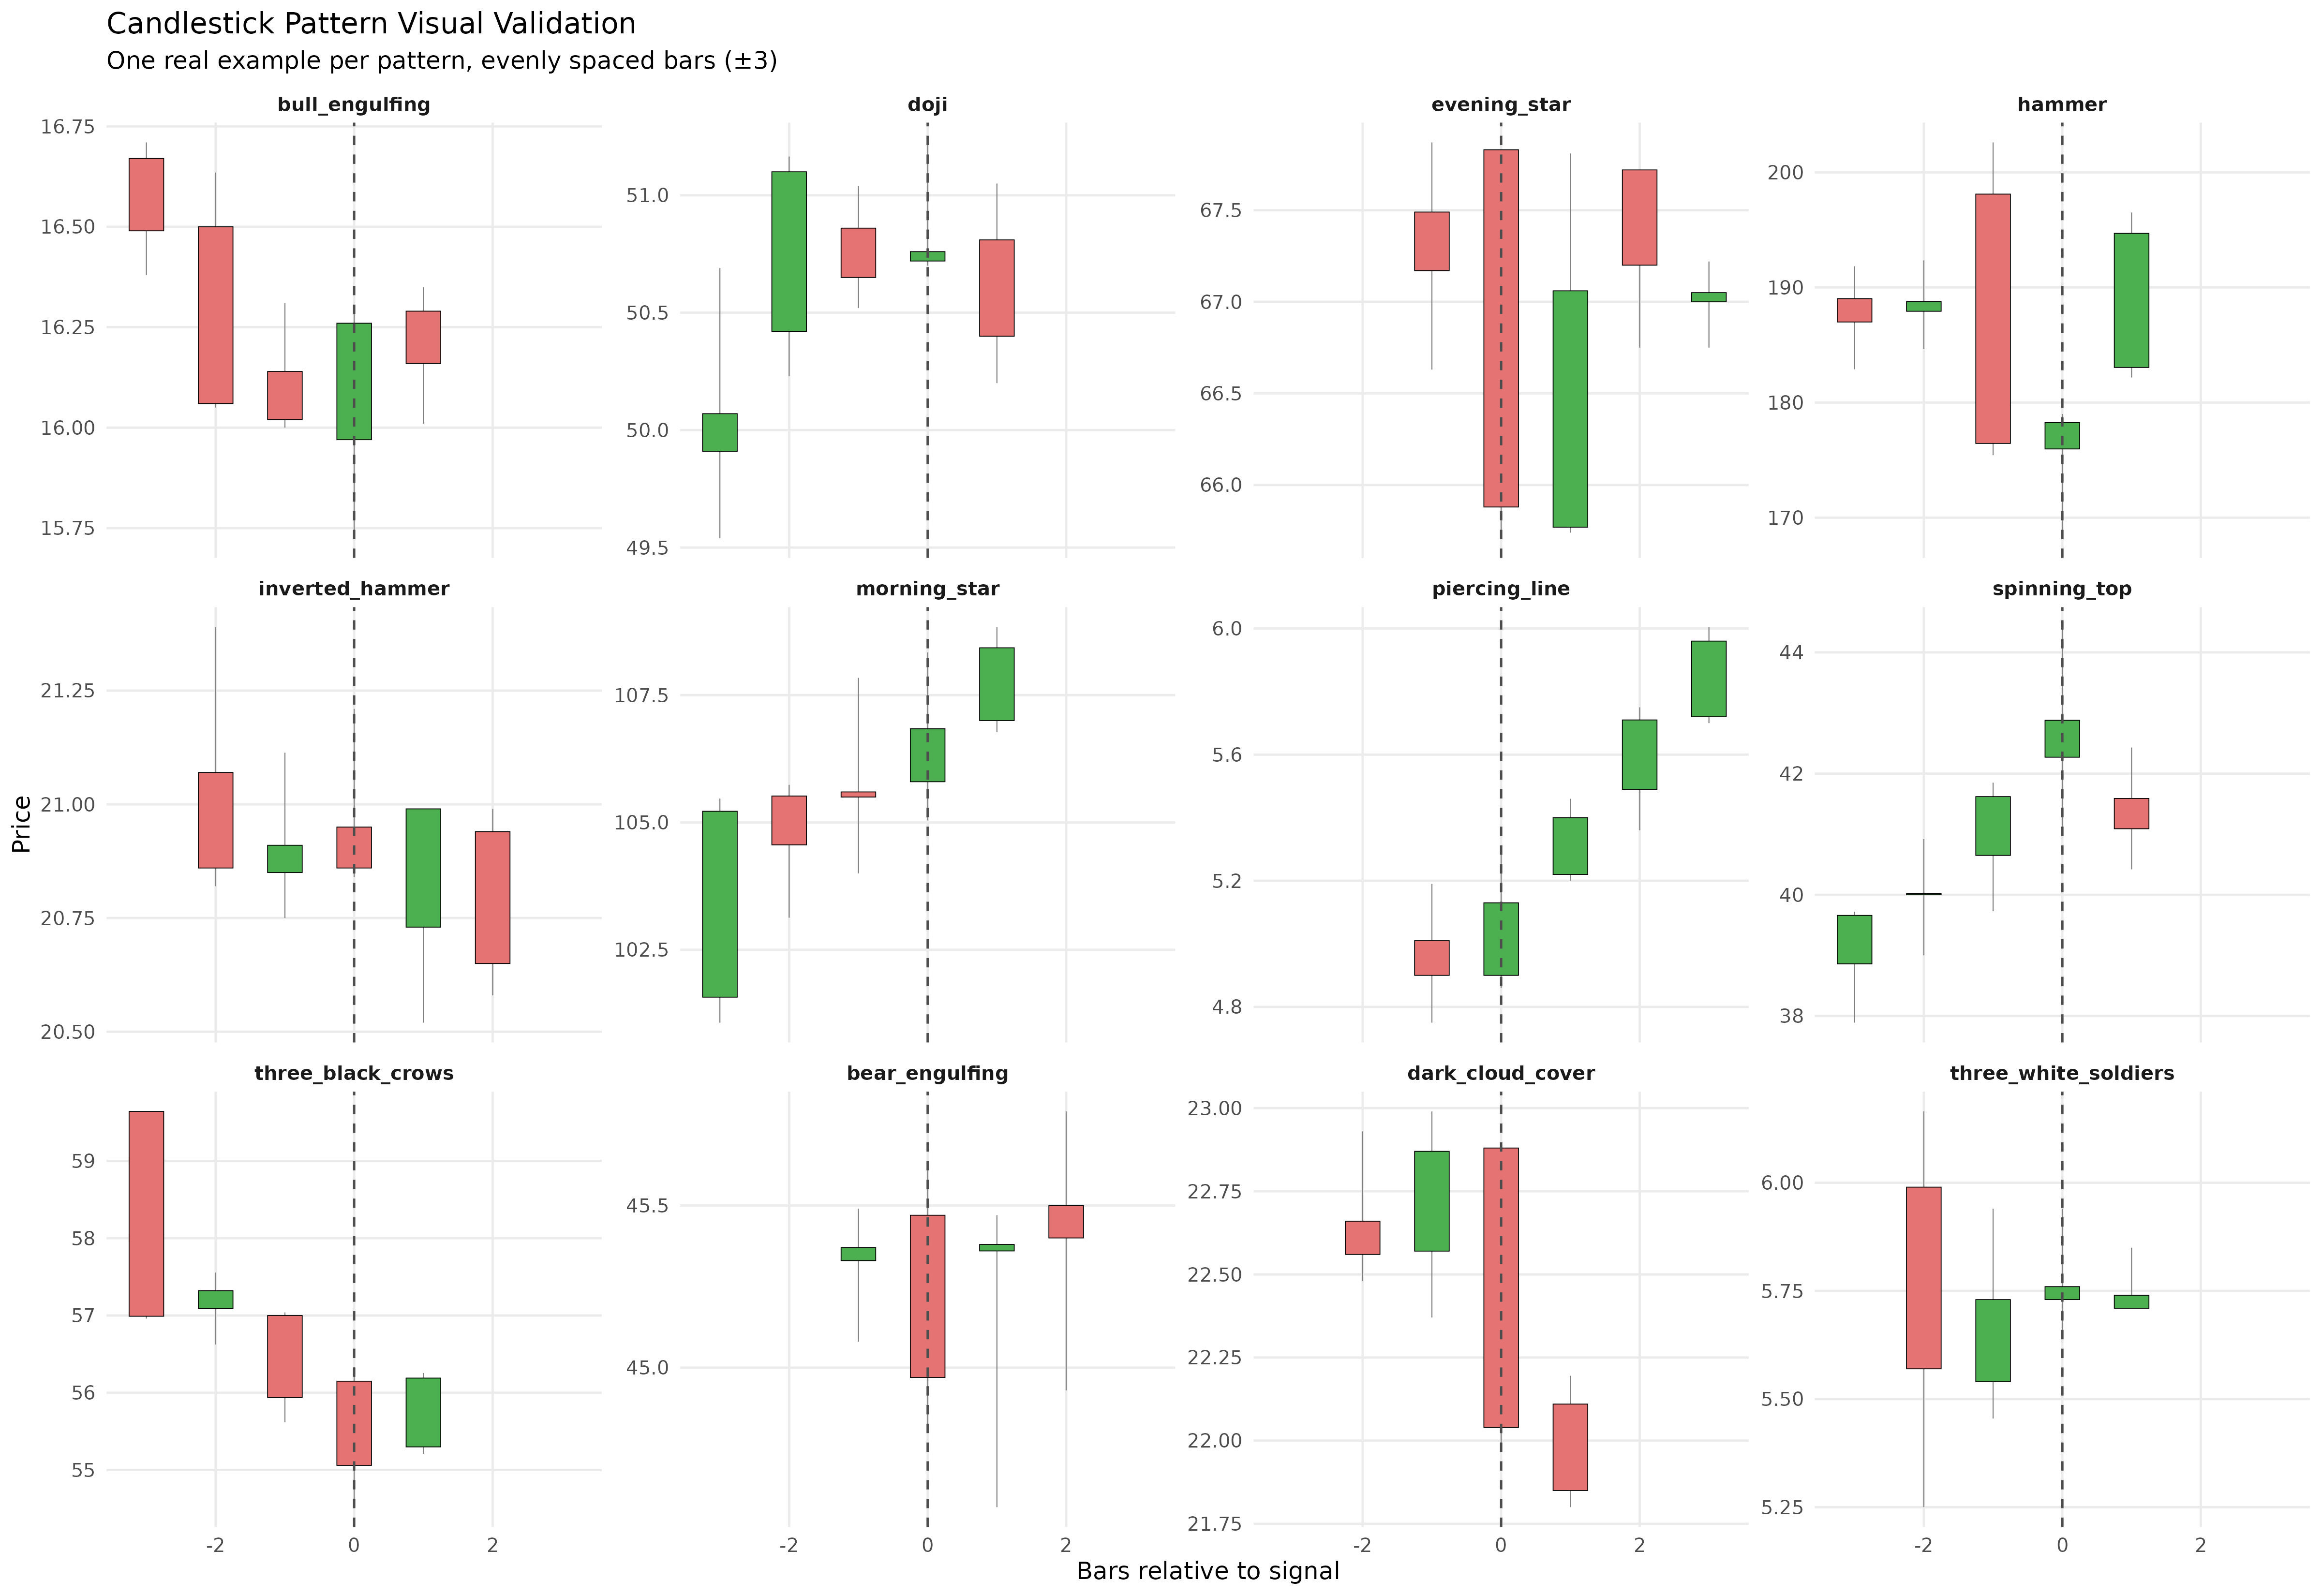
Two different questions, two different tests
At this point it is important to distinguish two separate analyses. Confusion here leads to incorrect conclusions.
Question 1
Do candlestick patterns add information once direction is known?
In this test, the benchmark is not the full market and it is not SPY.
Instead, each candlestick pattern is evaluated after controlling for a minimal momentum filter, using regime-matched controls drawn from the same universe of tickers.
Here, trend is defined in the most stripped-down way possible: whether prices have recently been rising or falling. This is intentional. The purpose of this test is not to model market structure, but to ask a narrow question:
Does a candlestick pattern add information beyond direction alone?
The process
Start with ~5,000 tickers
Classify each 5-day segment as an uptrend or downtrend based solely on whether the prior 5-day return is positive or negative
Within each regime, identify days where no candlestick pattern occurs
Use those days to construct clean baseline controls
Compare each of the 24 candlestick patterns to its corresponding control
This produces three reference series:
Downtrend Control (red): ordinary downtrend days with no pattern
Uptrend Control (blue): ordinary uptrend days with no pattern
Combined (gray): unconditional average across all regimes
Framed correctly, the question becomes:
Does a candlestick pattern add information beyond what a simple momentum filter already provides?
This isolates incremental signal rather than restating textbook interpretations of candlestick behavior.
How to read the bars
For each candlestick pattern:
Red bar: 5-day hit rate when the pattern appears during a downtrend
Blue bar: 5-day hit rate when the pattern appears during an uptrend
Gray bar: unconditional average hit rate for that pattern
The key comparison is pattern versus control within the same momentum regime, not pattern versus pattern.
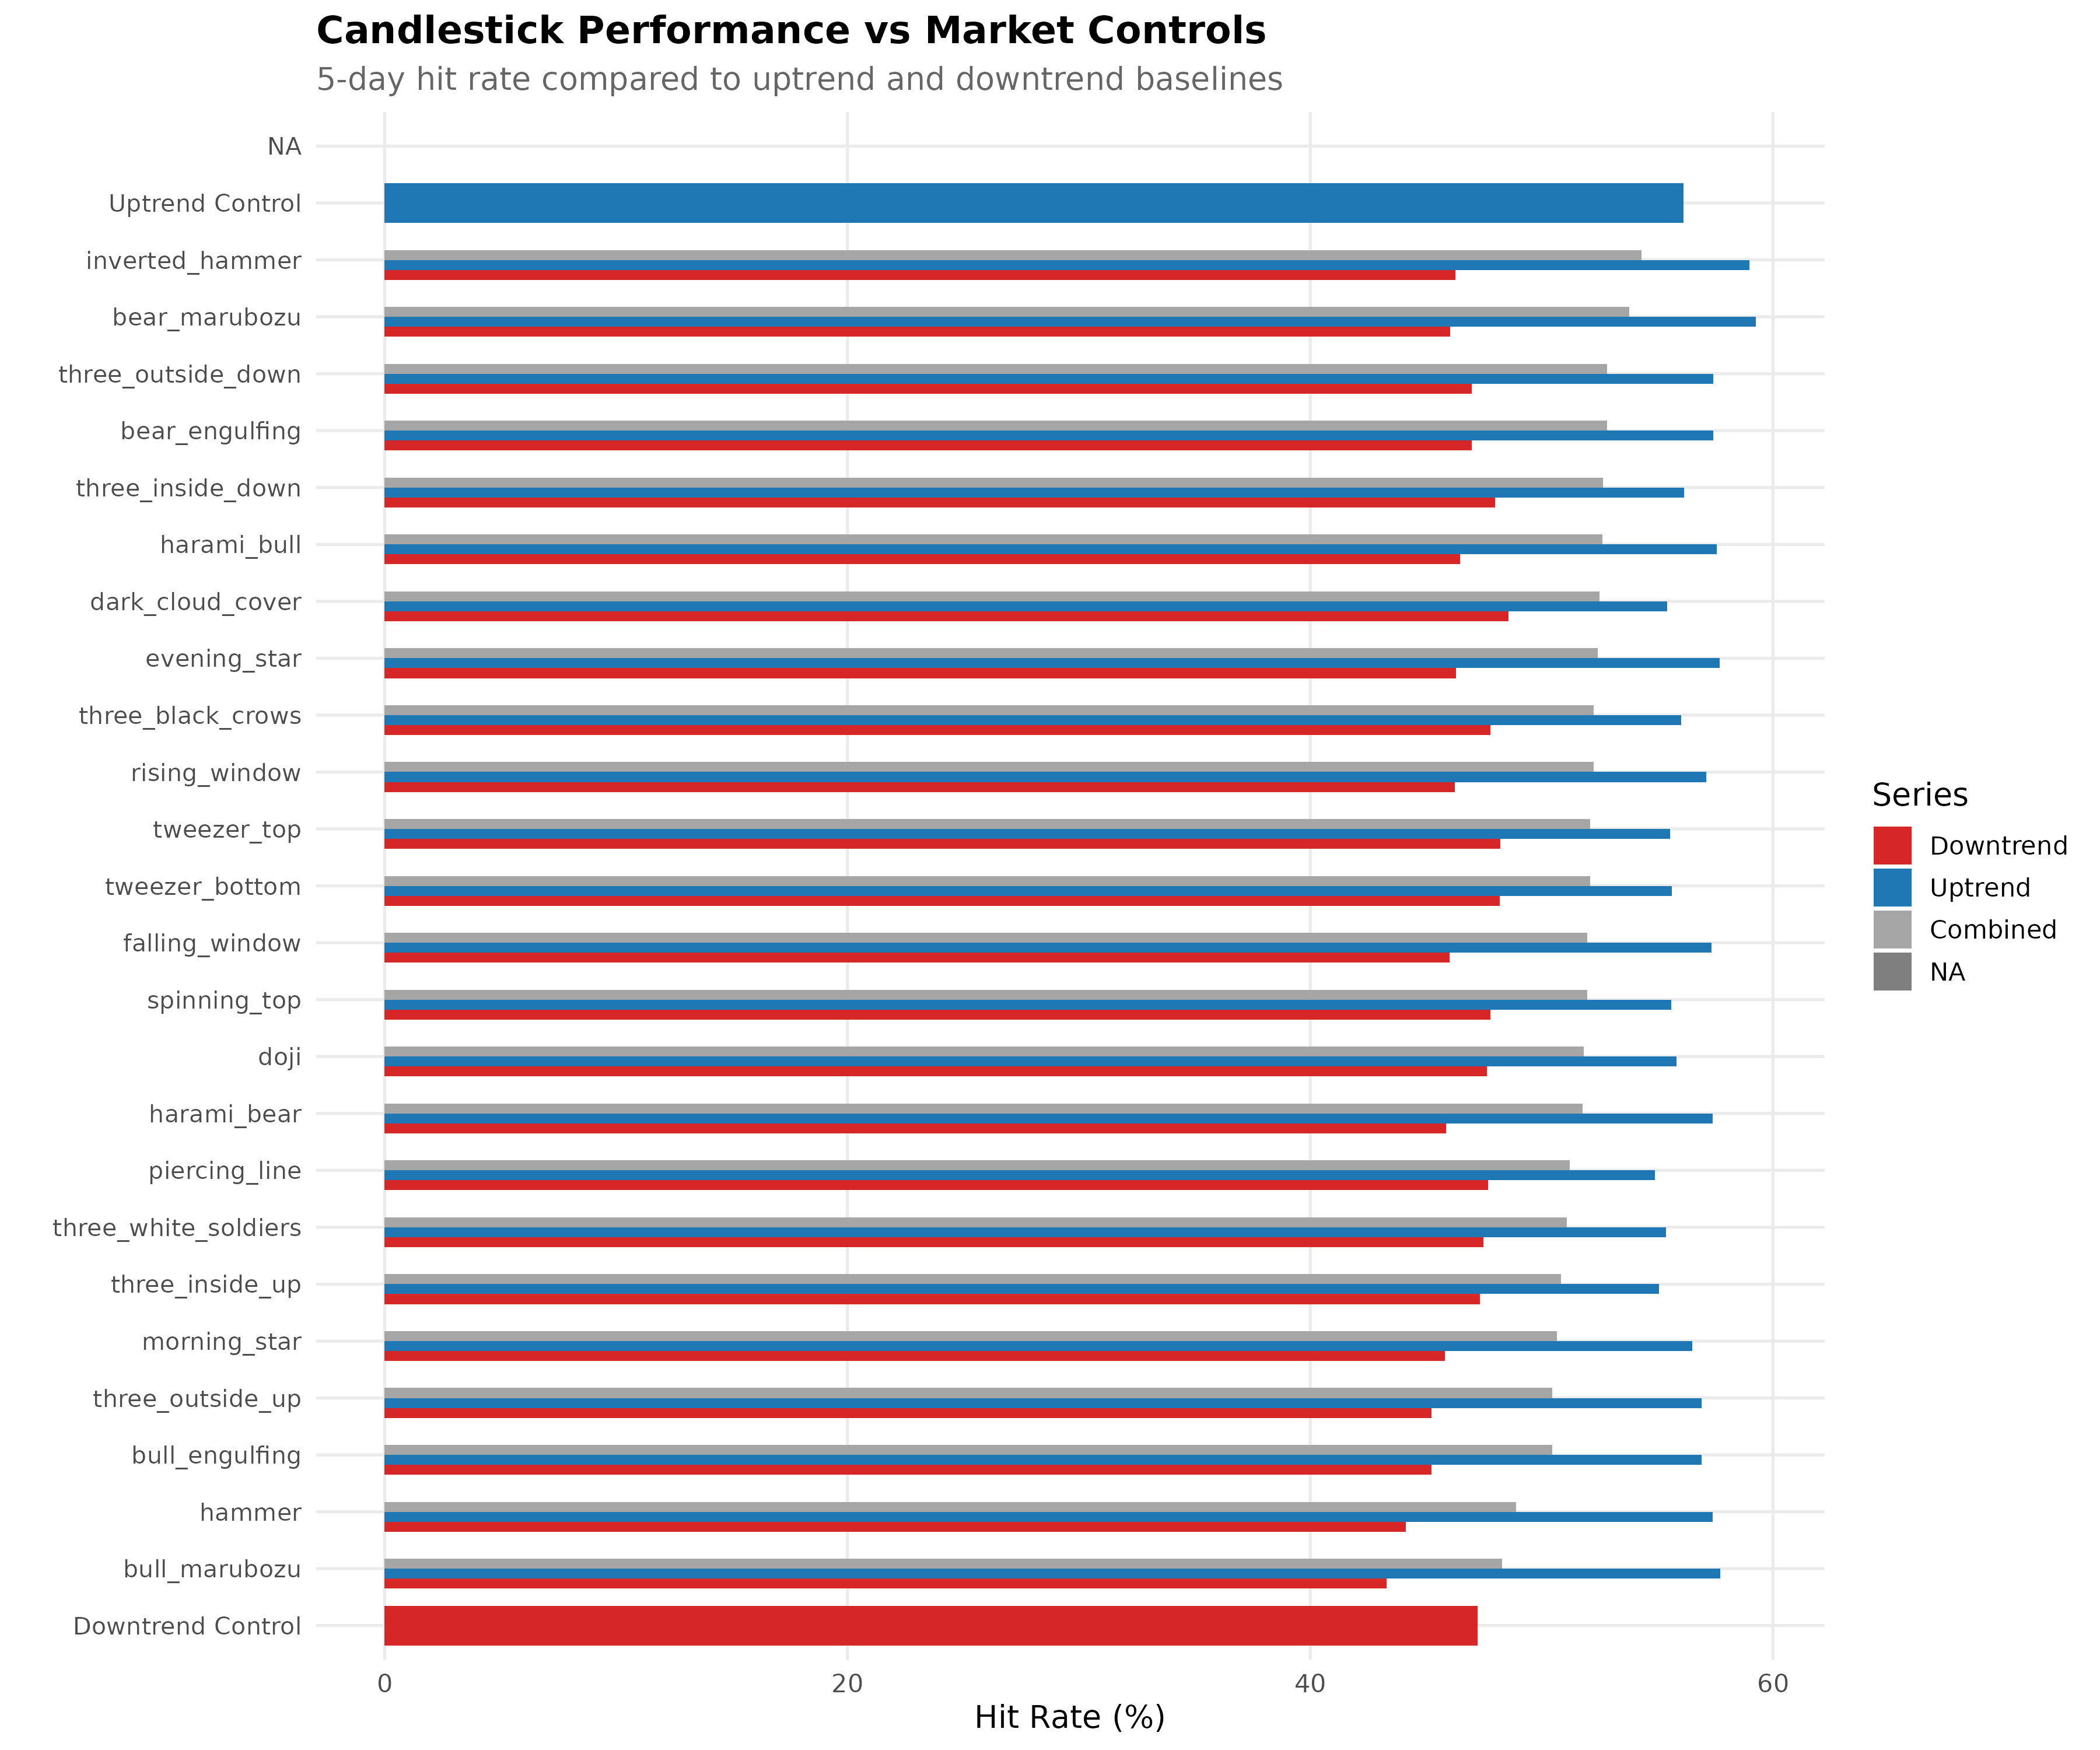
The central result
Across nearly every candlestick pattern, three conclusions are immediate.
1. Trend dominates outcome
Uptrend hit rates cluster tightly around ~57–60%, regardless of pattern.
Downtrend hit rates cluster around ~44–48%, regardless of pattern.
2. Most patterns hug their controls
For the majority of patterns, the red bar sits almost directly on top of the Downtrend Control, and the blue bar sits almost directly on top of the Uptrend Control.
3. Patterns rarely overpower direction
This is exactly what you would expect if candlestick patterns are marketed as predictors but function only as descriptors.
In a 5-day trend, Once direction is known, candlestick patterns add no measurable trading value at the individual ticker level. Their outcomes are indistinguishable from ordinary uptrend or downtrend days with no pattern present.
Put plainly: a bullish engulfing pattern does not predict that the market is about to turn bullish. It does not improve odds, accelerate reversals, or override the prevailing trend. It simply appears during a move that is already underway.
Question 2
After an established 20-day MA downtrend, does any pattern improve outcomes?
The second analysis asks a narrower and more disciplined question.
Here, a downtrend is a price-based regime defined before any candlestick signal appears.
An observation qualifies as a downtrend only if all of the following conditions are true on the signal day:
Price is below its 20-day and 50-day simple moving averages.
The 20-day moving average is declining.
The price today is lower than it was 20 trading days ago.
These conditions describe an already-established decline. They do not imply a fresh break, a moving-average crossover, or an imminent reversal.
This definition fixes the market environment in advance using only lagged price information, eliminating any forward-looking or outcome-based classification.
What is being compared
Within this strictly defined downtrend regime, outcomes are compared between two groups:
Pattern events: days where one of five predefined candlestick patterns appears
(hammer, inverted hammer, bullish engulfing, morning star, piercing line)Control events: days in the same downtrend regime where no candlestick pattern appears
Every event in this analysis occurs under identical trend conditions.
The only variable allowed to differ is the presence or absence of a specific candlestick pattern.
After running the full pipeline, which produced 3,187,703 downtrend-qualified events, most of the tested candlestick patterns failed to improve outcomes relative to the matched downtrend control.
One did not.
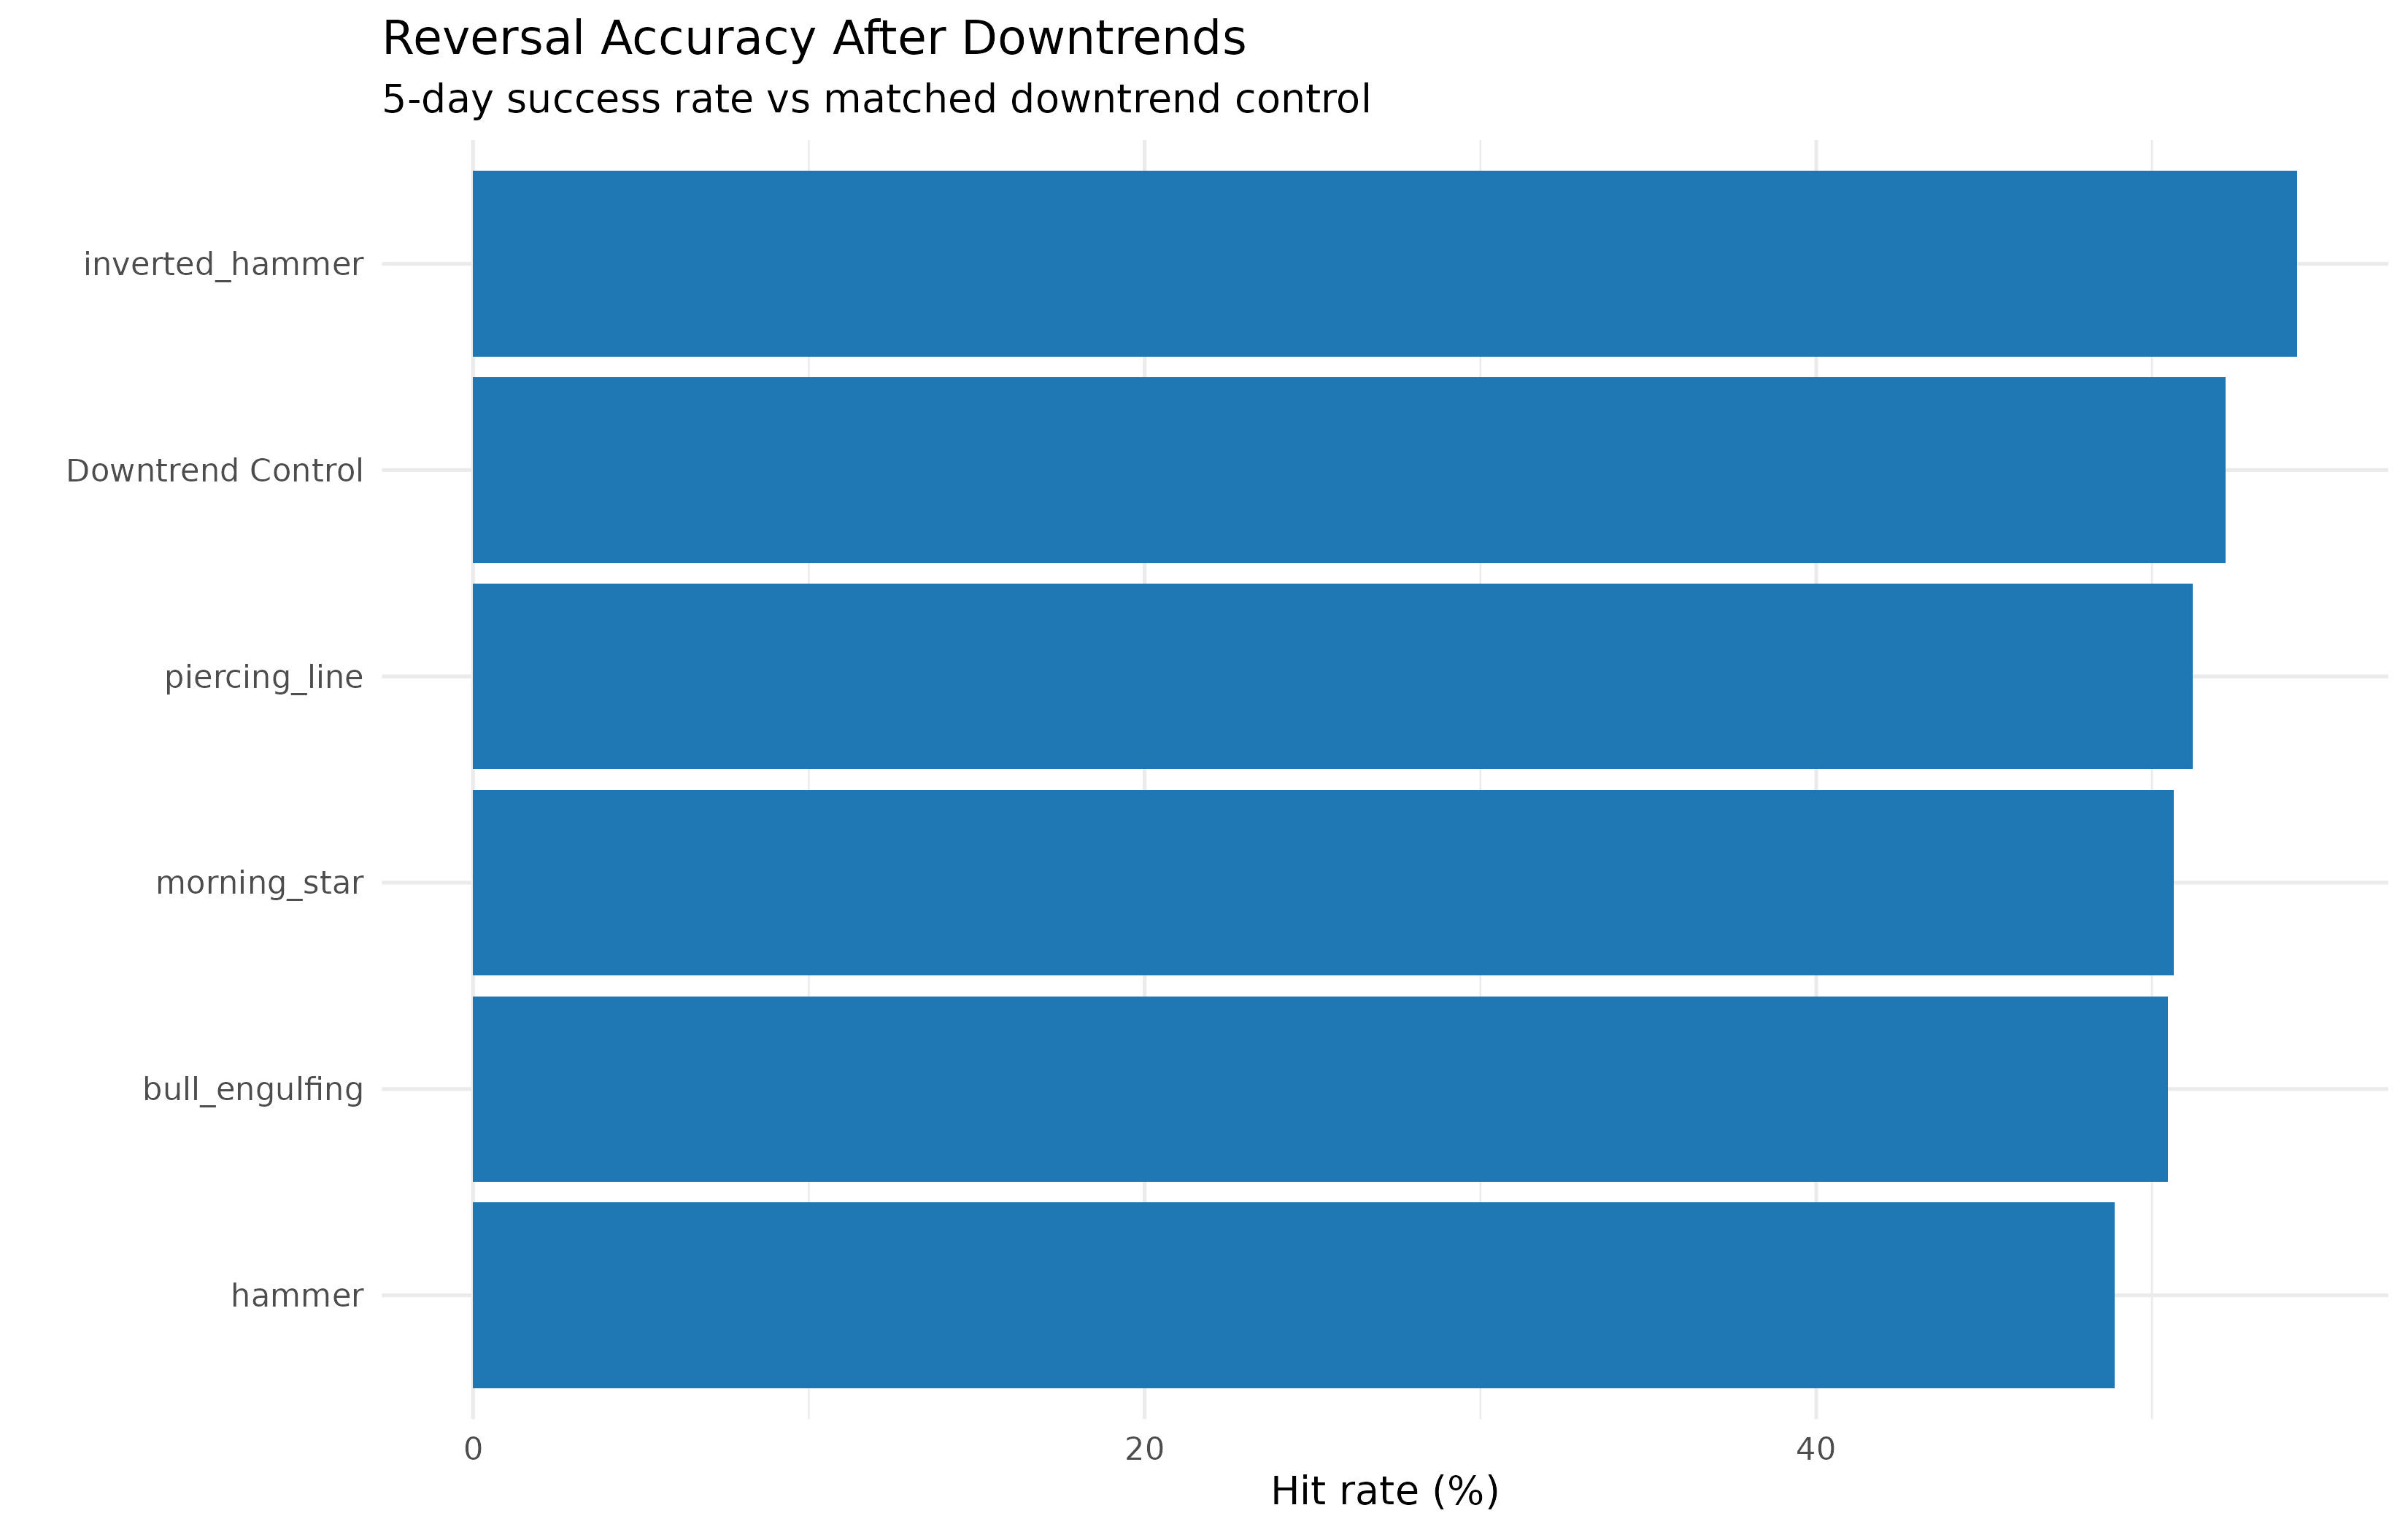
The unexpected result
Inverted Hammer (~55–56%)
The only pattern that produces a consistent, statistically meaningful lift over the downtrend control.Downtrend Control (~52–53%)
Even after sustained declines, prices tend to drift modestly higher over the next five days. Mean reversion exists without any pattern.Hammer (~49–50%)
Slightly worse than the control.Bullish Engulfing / Morning Star / Piercing Line (~51–52%)
Visually compelling, statistically inert.
Horizon testing: 1, 5, and 10 days
Next, I isolated the inverted hammer and tested it directly against the matched downtrend control across three forward horizons: 1 day, 5 days, and 10 days.
This step matters because, in earlier studies, many patterns appeared to work at one horizon only to collapse when tested across others. Fragile effects tend to disappear once you change the holding period.
That did not happen here.
The inverted hammer’s edge persisted across all three horizons.
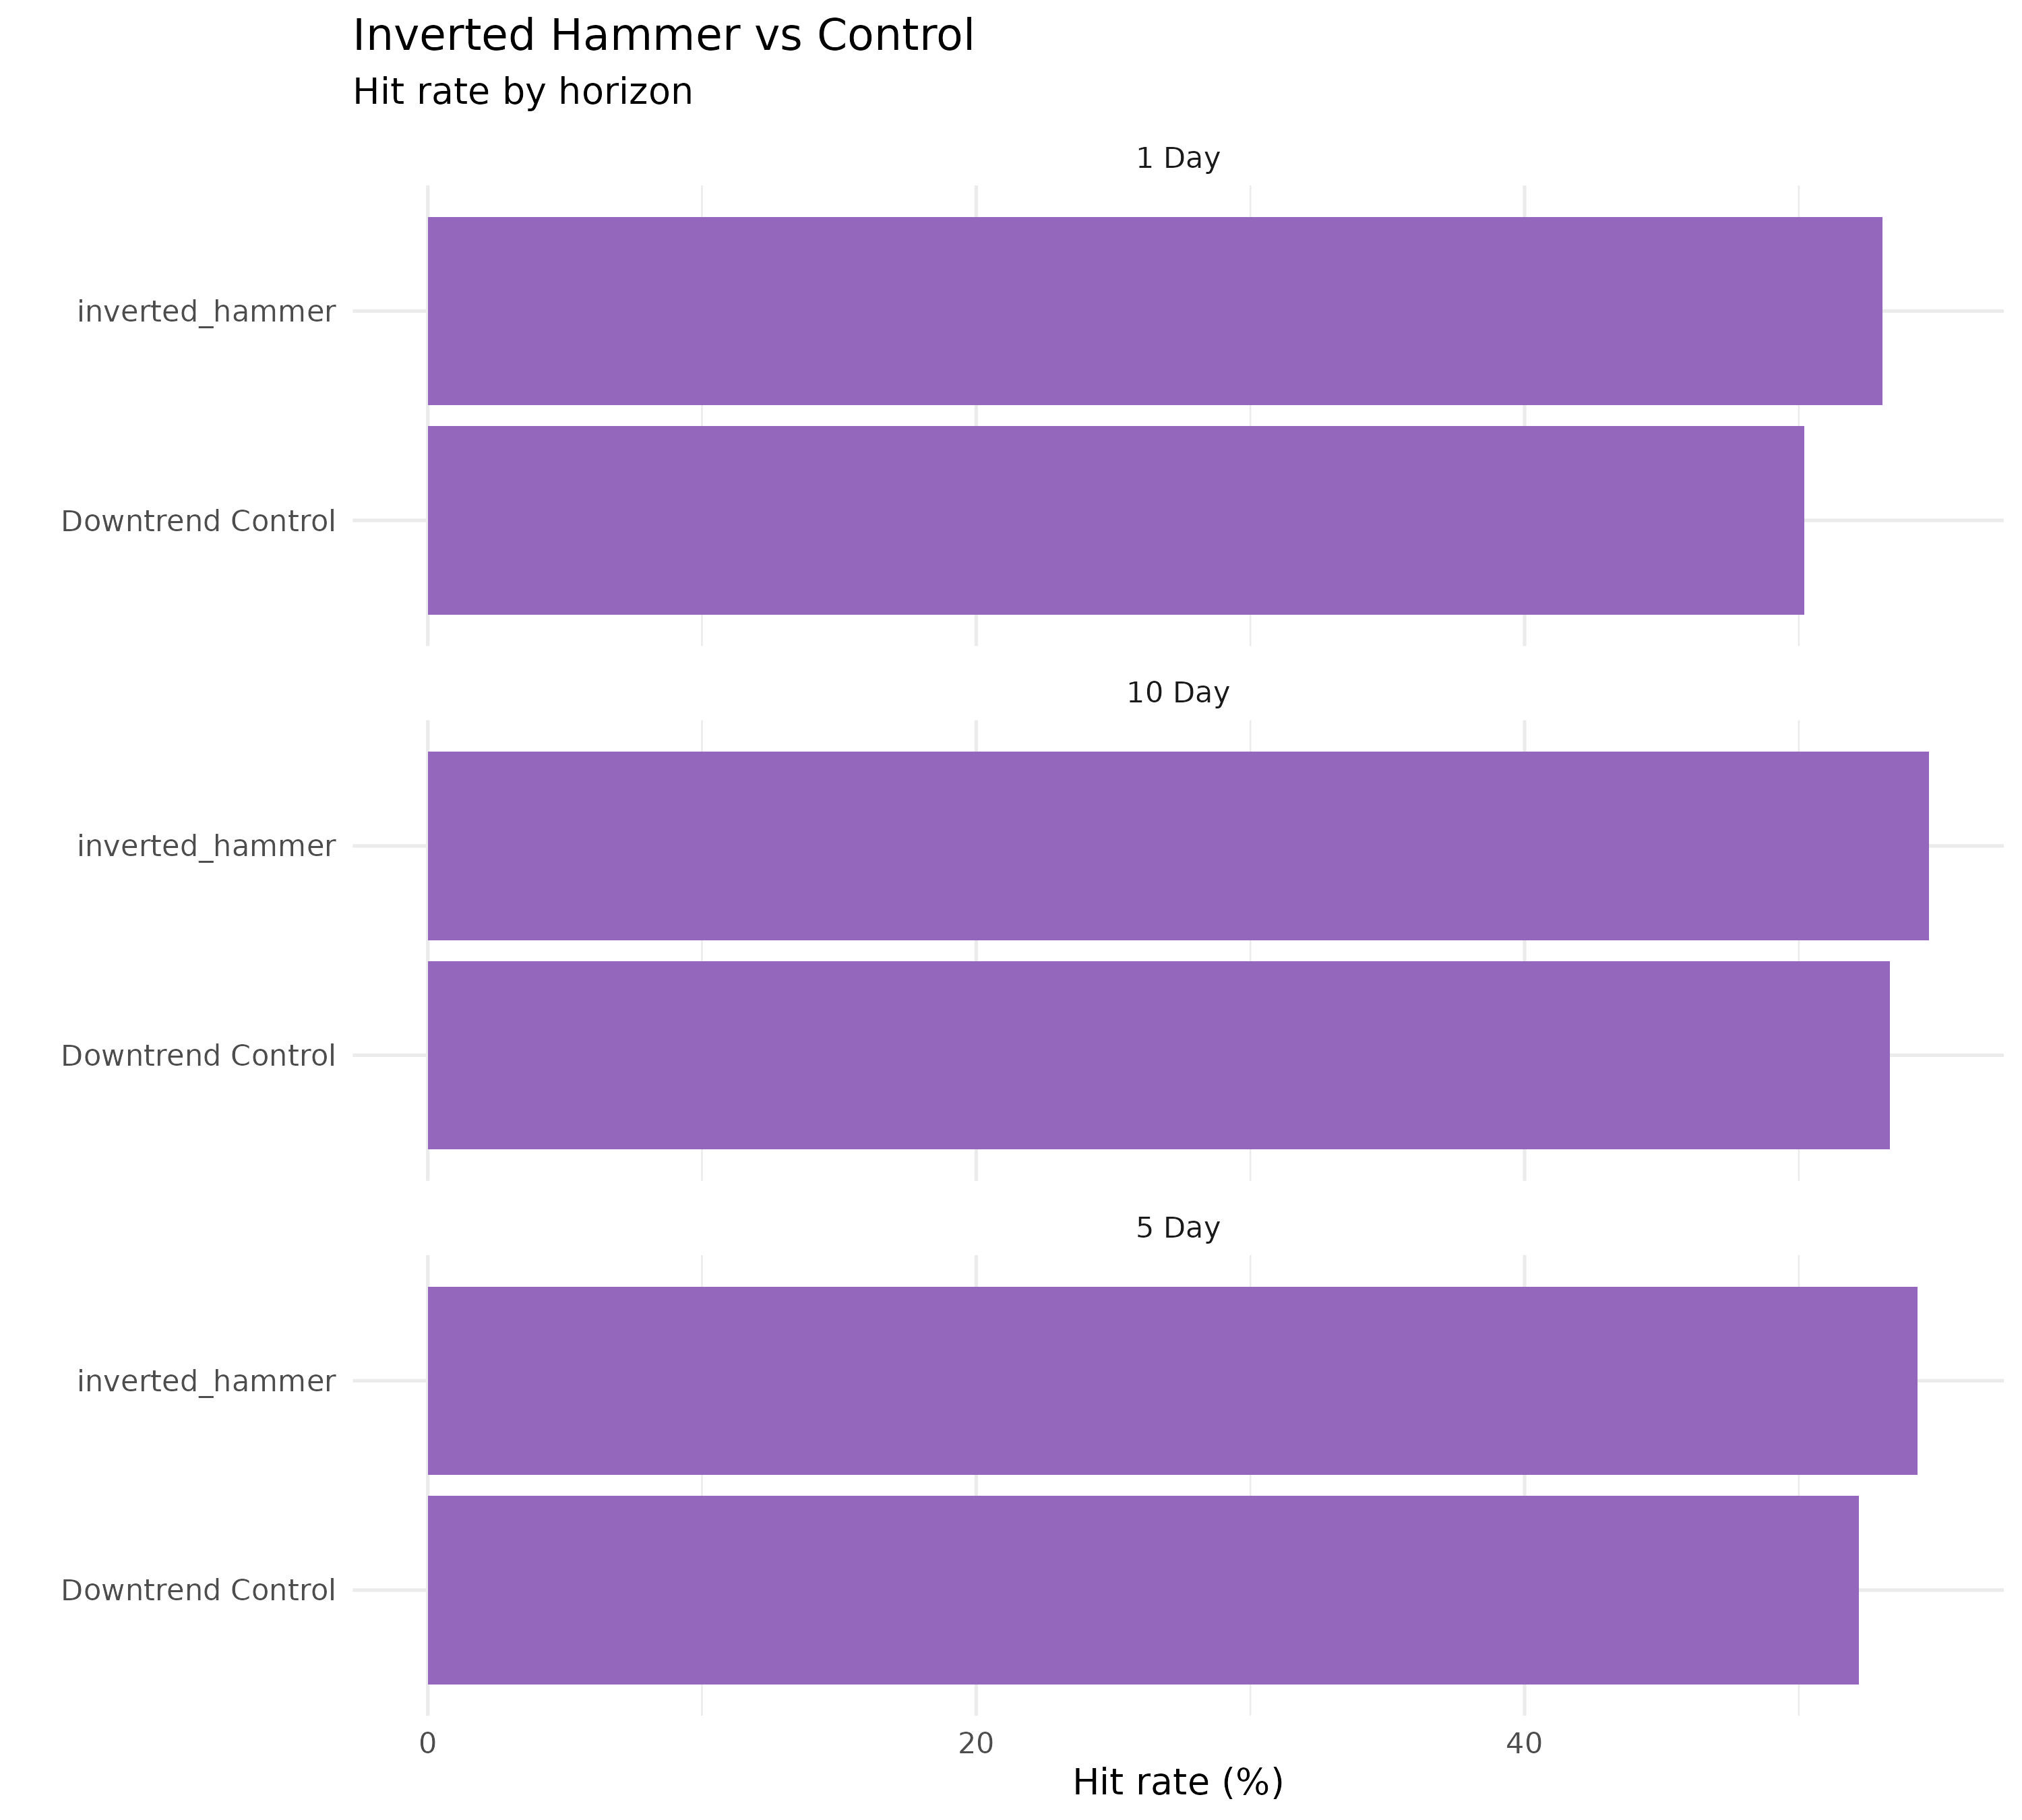
What the inverted hammer is actually capturing
At this point, the candle itself is not the point.
The inverted hammer appears to be a compressed descriptor for:
Late-stage downside pressure
Intraday downside rejection
Failed continuation within an already-defined downtrend
The candle is revealing seller exhaustion.
Sample size removes doubt
The sample sizes are not marginal:
             pattern       N
              <char>   <int>
1:   inverted_hammer  216793
2: Downtrend Control 1338850
At this scale, a 1–2 percentage point improvement is not cosmetic. It is many standard deviations away from zero.
That eliminates randomness as an explanation.
The key result
> delta_tbl
             pattern      rate      delta
              <char>     <num>      <num>
1:   inverted_hammer 0.5432279 0.02120878
2: Downtrend Control 0.5220191 0.02120878
This is incremental information beyond trend context.
Conclusion
Only one candlestick pattern works and only in a very narrow, context-dependent way.
Does it work over a 5-day downturn?
No. It does not function as a reversal signal over short horizons.
Does it work intraday or on 1-hour regimes?
There is no evidence it does, and nothing in the results suggests it would.
Does it work on daily data within a 20-day / 50-day SMA downtrend?
Barely—but yes. A small, statistically significant effect appears only inside an already-established bearish regime.
Across millions of observations, most candlestick patterns add no measurable information once trend is controlled, whether trend is defined using short-horizon momentum or longer-horizon structural filters. In both cases, outcomes are indistinguishable from matched periods with no pattern present.
The inverted hammer is the only exception.
Even here, the effect is narrow. The inverted hammer does not function as a reversal signal over a 5-day horizon, nor does it indicate a transition to a bullish regime under a 20-day moving-average framework. It does not overpower prevailing downside structure.
What the inverted hammer does produce, regardless of whether the candle closes bullish or bearish, is a small but statistically significant improvement in short-term outcomes relative to an otherwise identical downtrend within an already-established 20-day / 50-day SMA bear cross, where no visual exhaustion signal is present.
Rather than chasing visual signals, Stratum tracks rotation, structure, and behavioral stress across regimes, focusing on what the market is doing, not what it looks like.
📉 2018 Volmageddon — Shifted into bonds and gold
🦠 2020 COVID Crash — Early defense
🏦 2022 Rate Cycle — Avoided tech collapse
🔁 2024 Reflation — Led SPY back into offense
Learn about the Stratum Index »
Disclaimer: This analysis is for research and educational purposes only and does not constitute investment advice. Results are based on historical data and systematic backtests; past performance does not guarantee future outcomes. Market behavior changes, and observed effects may not persist. No consideration is given to transaction costs, slippage, or execution constraints unless explicitly stated.
Only about half way through and gotta head back to work, but really awesome work here, Quanta! The way you framed regime-matched controls makes it very easy to understand though and I'd agree with it that most people aren’t testing signal, they’re just restating direction in a different visual language. Excited to finish this out later on!