
Q72 Weekly Data Release: Why I Don’t Trust My Own Models—Until I Do
July 21–July 25, 2025: Q72’s Weekly Data Release drops every Sunday. Paid readers get early access to Stratum’s rebalanced allocations—backtested to ~60% annualized returns.

First off—thank you.
What began as a simple experiment has started to feel like something more.
The support from this community has turned this project into more than just a backtest.
It’s become a shared pursuit—of clarity, of discipline, of edge.
And I want to share why that matters to me.
Because it wasn’t always this way.
I still remember 2021—quiet mornings, too much coffee, and a folder full of half-finished models. That folder still exists. It’s even bigger now.
In 2021 I was just beginning to understand how fragile good ideas could be.
Then one backtest stood out.
It was elegant, clean. The curves rose smoothly. The drawdowns were shallow.
On paper, it looked like I’d built something durable—maybe even special.
It had a 31.5% annualised return, and a 9.8% max drawdown.
But something felt off. So I went back into the code.
I spent two full days going through timestamp checks, variable logs, and retracing every function call.
Eventually, I found it: one line. A single line pulling real-time data into what should’ve been a lagged input.
That was all it took. Once fixed, most of the alpha vanished.
Looking back, it wasn’t a failure. It was a filter.
Because building models is easy.
Understanding what they actually do—that takes work.
Keeping them honest? That takes discipline.
You don’t start with simplicity.
You debug your way into it.
You strip away every illusion until what’s left holds up—week after week, live.
Simplicity isn’t the spark.
It’s the stress-tested core.
That’s what I’m building here.
And that’s why it matters.
We Keep Talking About Beta…
So here’s the thing.
Beta is one of those deceptively simple ideas that finance nerds like me can obsess over for hours.
I recently read a paper arguing you could explain nearly all of momentum’s returns just by anticipating future beta shifts. That absolutely lit me up.
Then I read another paper claiming you could explain momentum by the timing of institutional deposits—specifically, which days of the week they hit.
Which one’s right? I don’t know. Maybe neither. Maybe both.
But it made me think about the Stratum Index differently.
Because most of us measure markets like we’re holding a ruler—clean, linear, one-dimensional.
But markets aren’t built that way. They flex, bend, and breathe with risk.
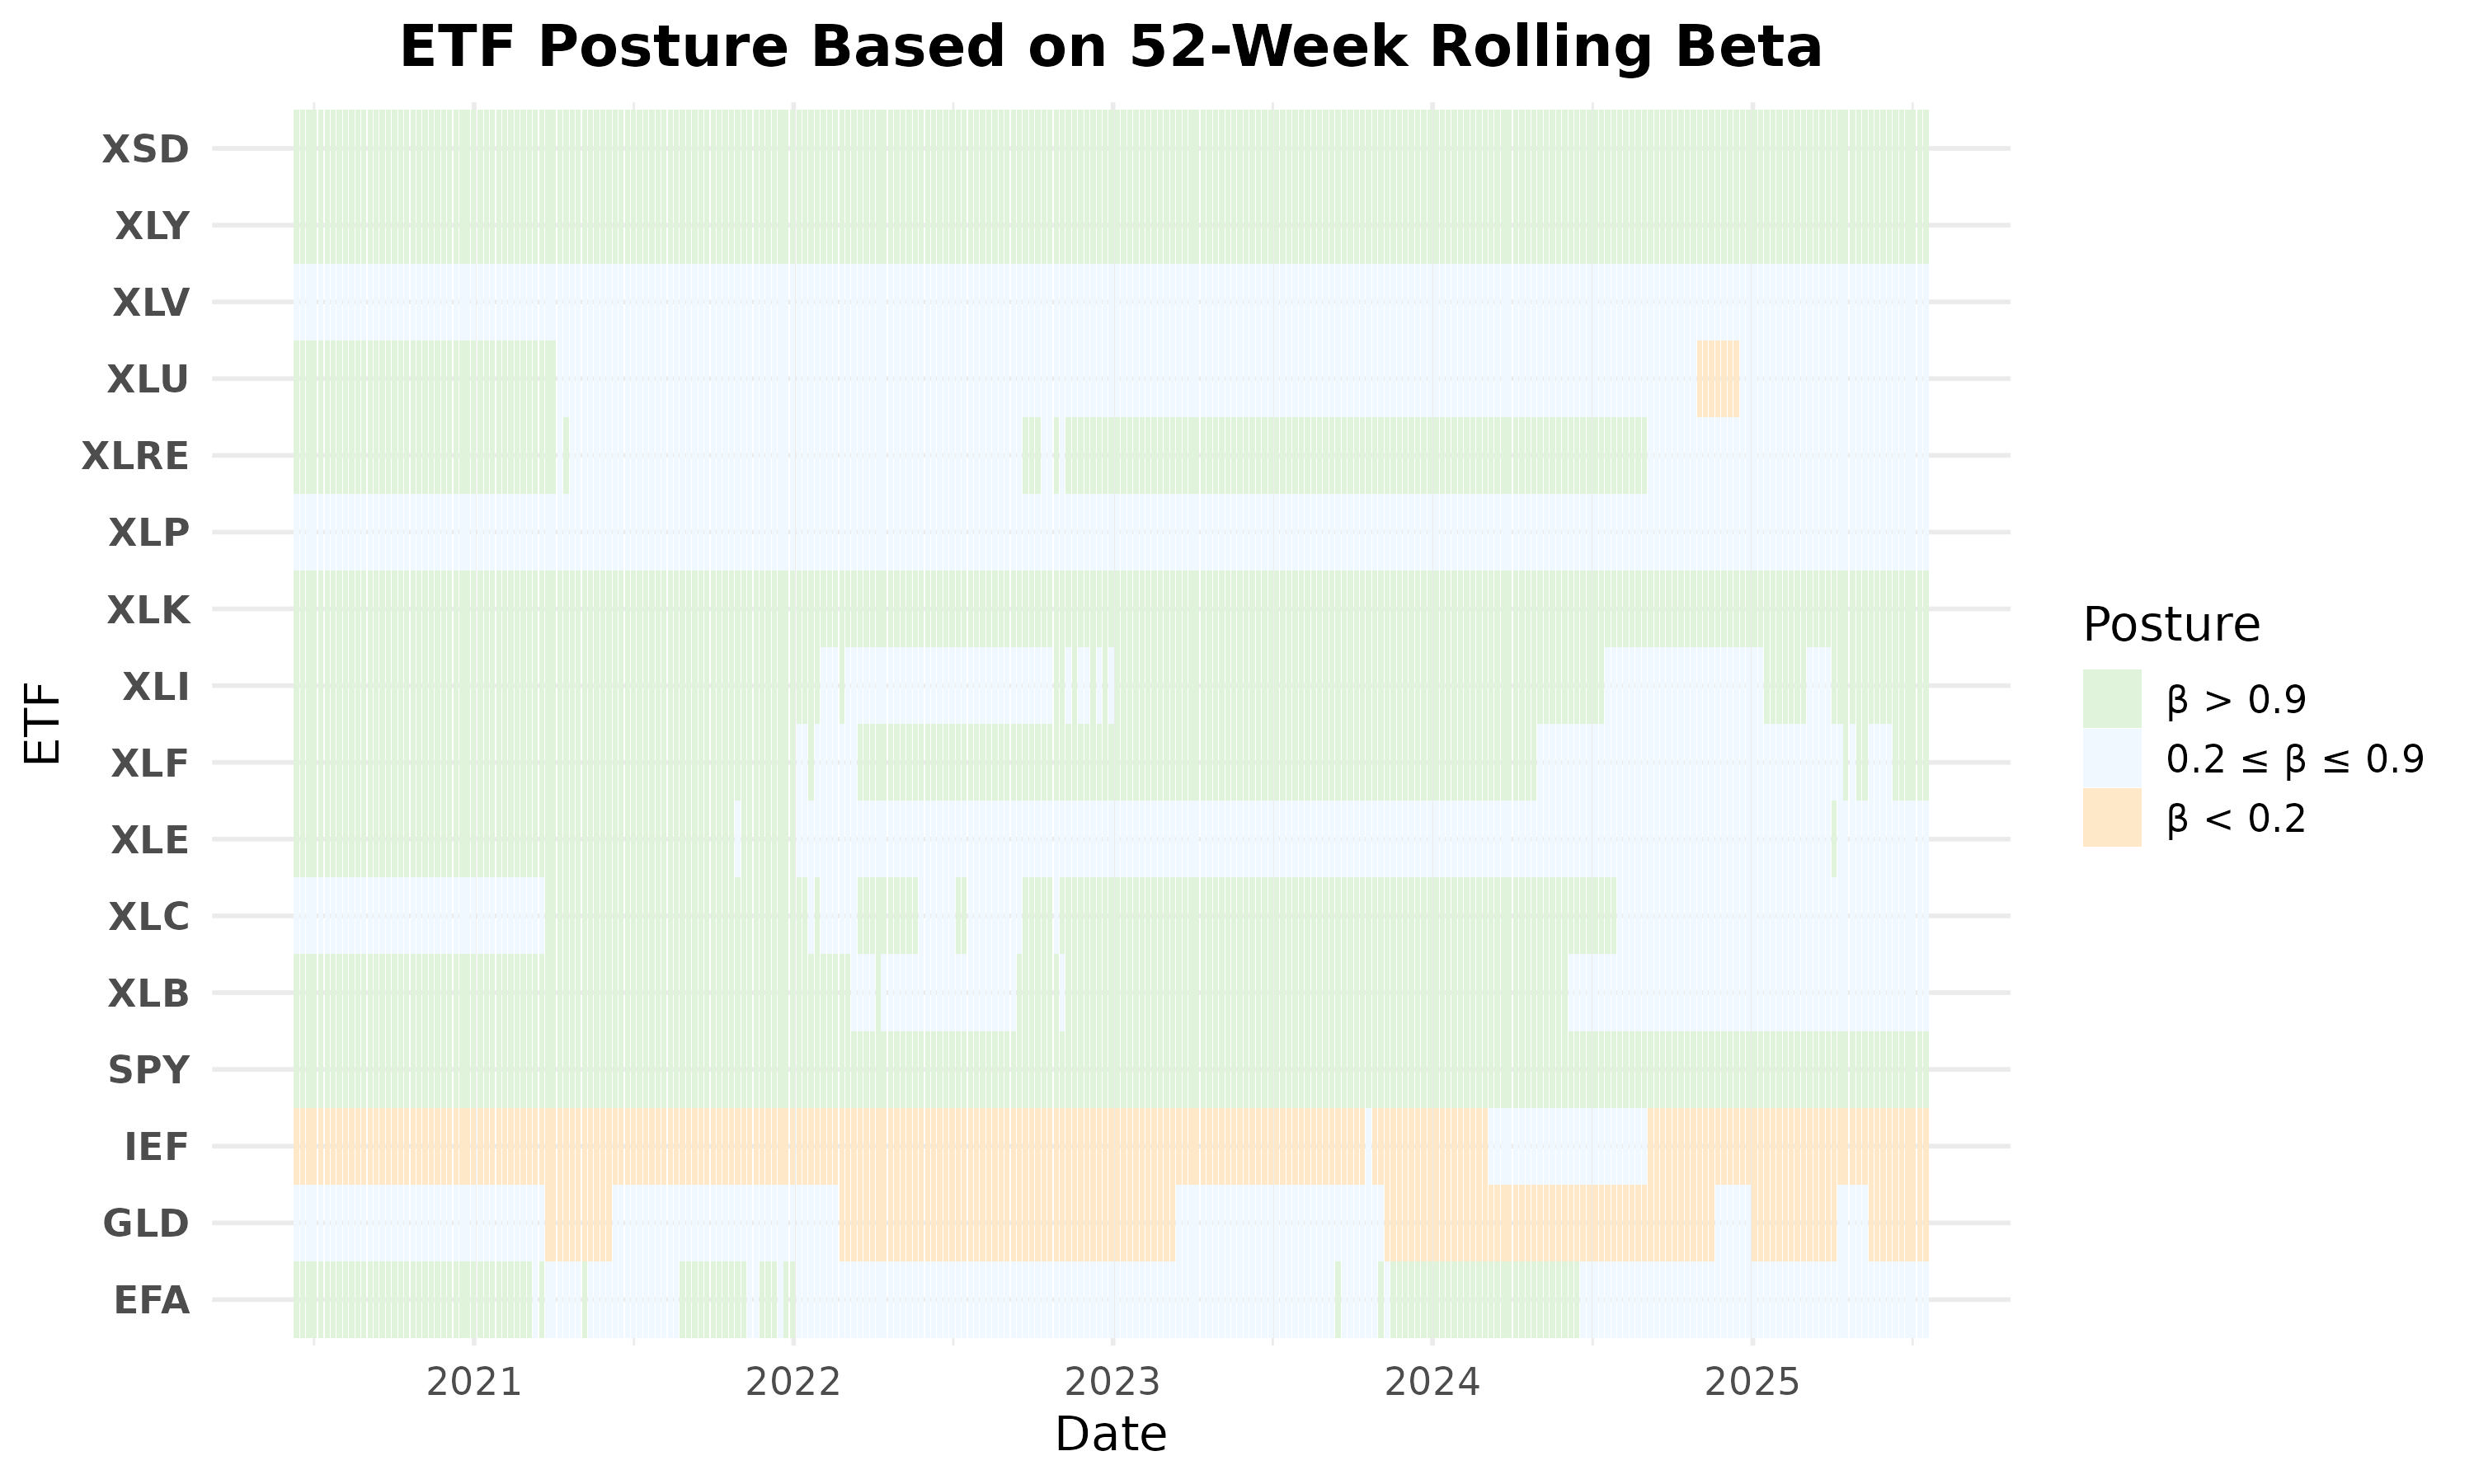
Beneath all the weekly rotation and ETF reshuffling, something deeper is happening: the model is cycling through beta clusters.
The ultimate decision-maker is price—but it’s not blindly chasing it. It’s rotating through regimes of risk. Sets of exposure that, in theory, could be predictive—not because of momentum itself, but because beta drifts with the business cycle.
Beta isn’t static. It expands, compresses, mutates.
So what if we built something that adjusted not just to price—but to how risk itself is changing shape?
That’s the research problem I’m knee-deep in now.
It might take years to solve.
And maybe it never resolves cleanly.
Momentum isn’t just about chasing returns.
It’s about understanding how capital behaves under pressure.
And that’s the game I’m playing.
Business Cycle Commentary
Are we in a recession? A tech-led expansion? A new growth phase? Let’s find out!
SPY doesn’t move aimlessly—it rotates behaviorally. This past week, the S&P gained +0.635%, while the Stratum Index underperformed slightly. Not because it was offside, but because it prioritized durability. The model leaned into Utilities and Gold, reading the market’s internal tone as risk-averse beneath the surface rally.
And honestly—it’s a shame Utilities had another strong week.
Because if Utilities hadn’t, the model might’ve pivoted into Semiconductors or Tech—sectors sitting just below the allocation threshold. The posture was ready to rotate. It just didn’t get the signal.
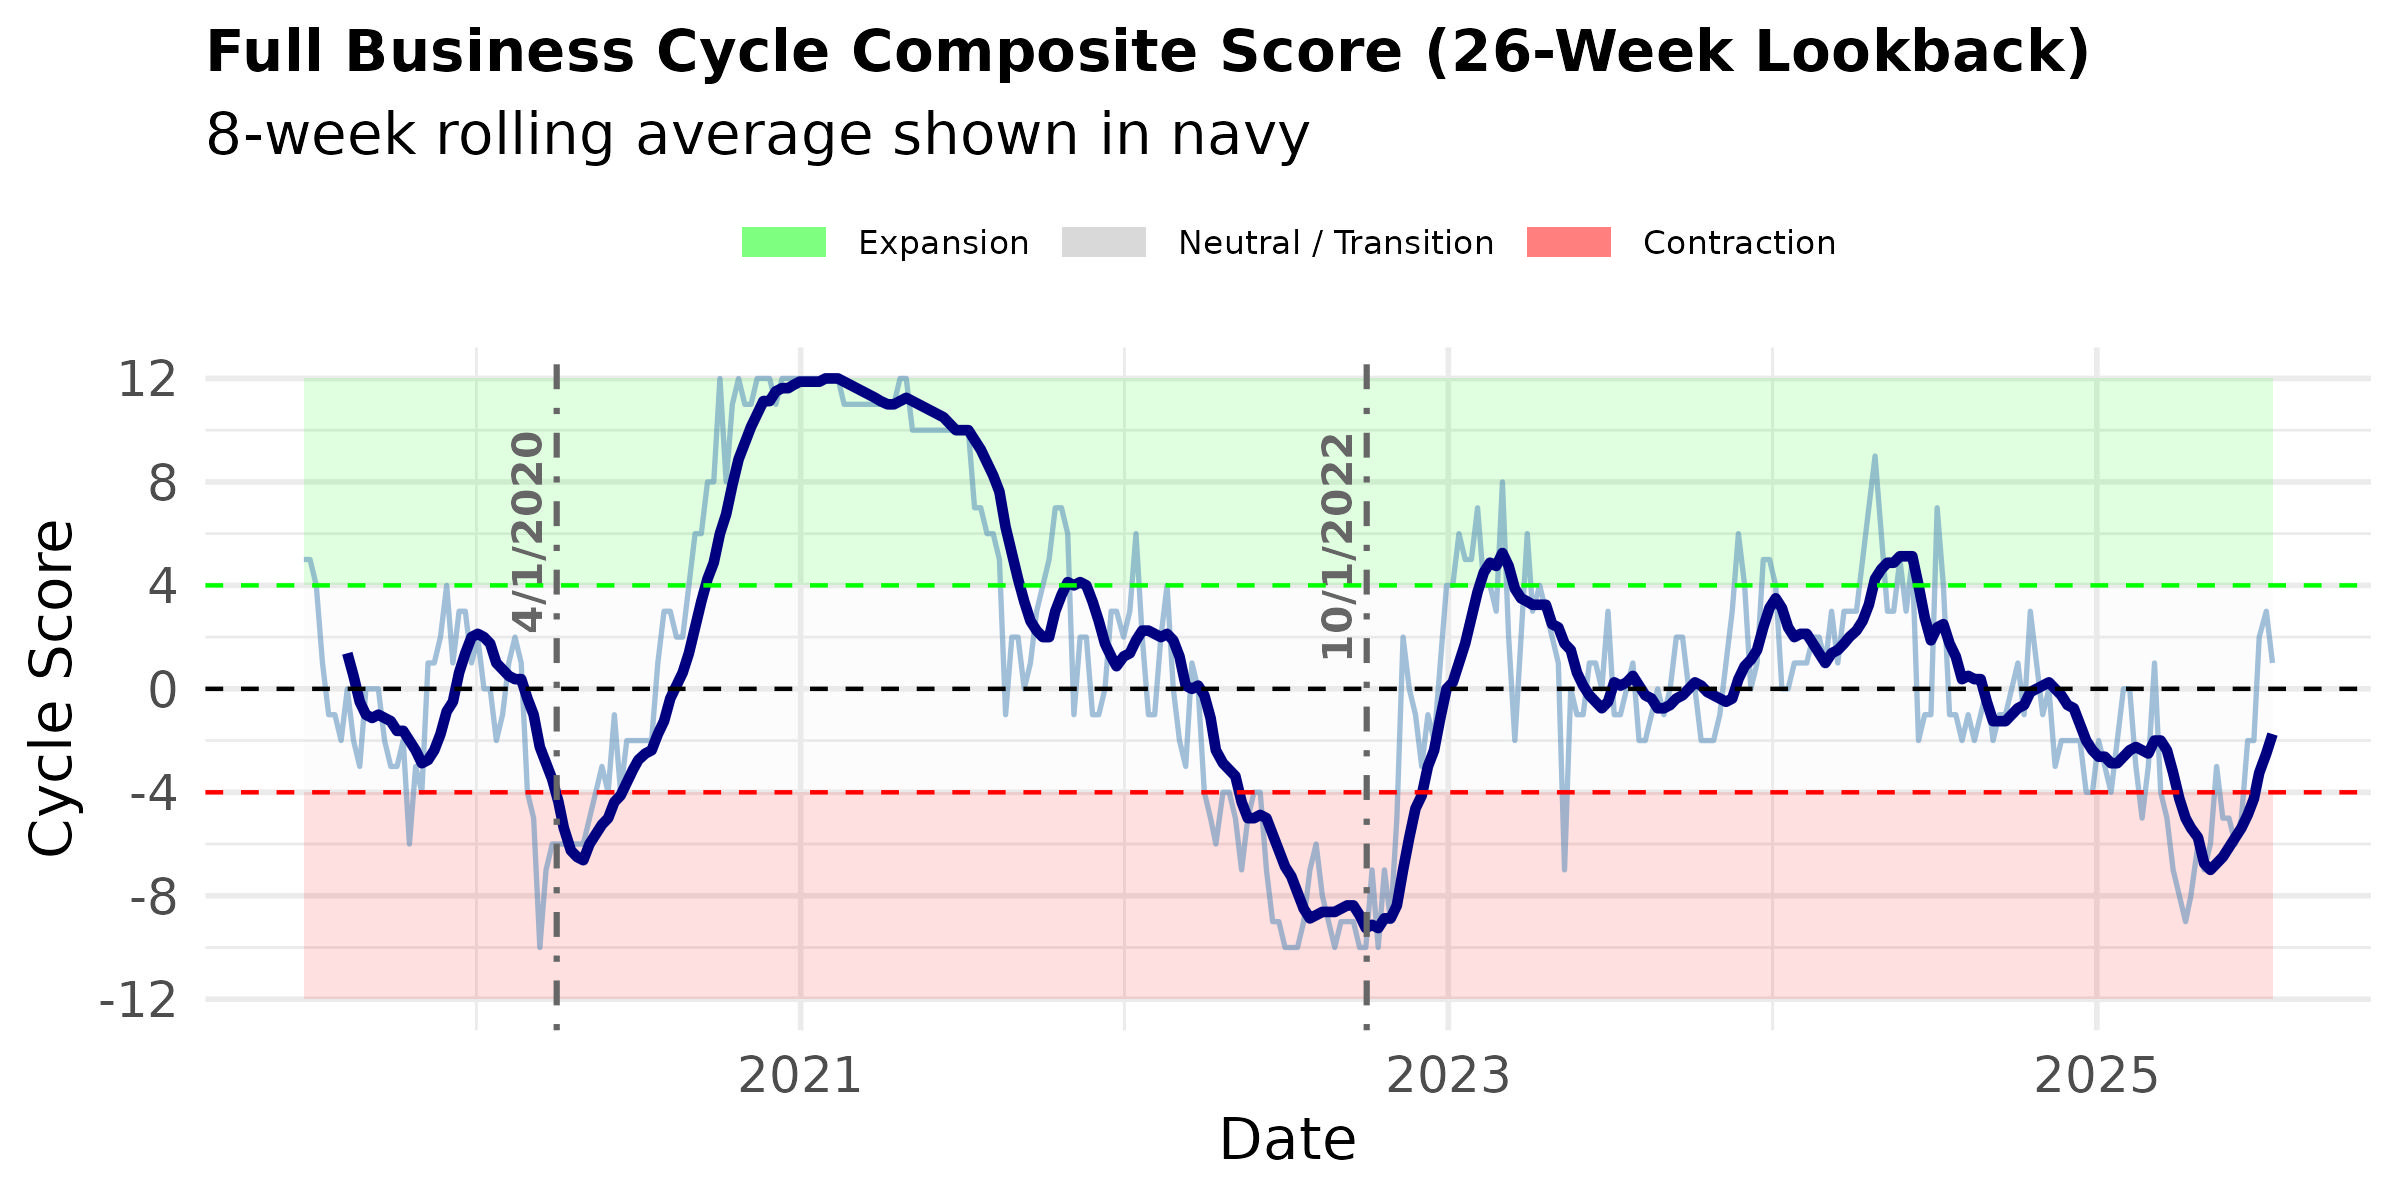
We remain stuck in Contraction—but the Business Cycle Composite Score is starting to rise.
In backtests, direction matters as well as score. Rising scores suggest risk appetite is quietly rebuilding—even if market tone still favors defense.
The current 8-week rolling average holds steady at −1.75.
This composite blends relative returns across behavioral pivots: cyclicals vs. defensives, high yield vs. Treasuries, and TIPs vs. cash. Think of it as a behavioral compass—not built to predict, but to reflect where capital is leaning.
Right now, the pressure is sideways. Not enough weakness to trigger panic, not enough strength to commit.
And that signals hesitation—with a tilt toward defense.
52 Week Sector Rankings & Confidence
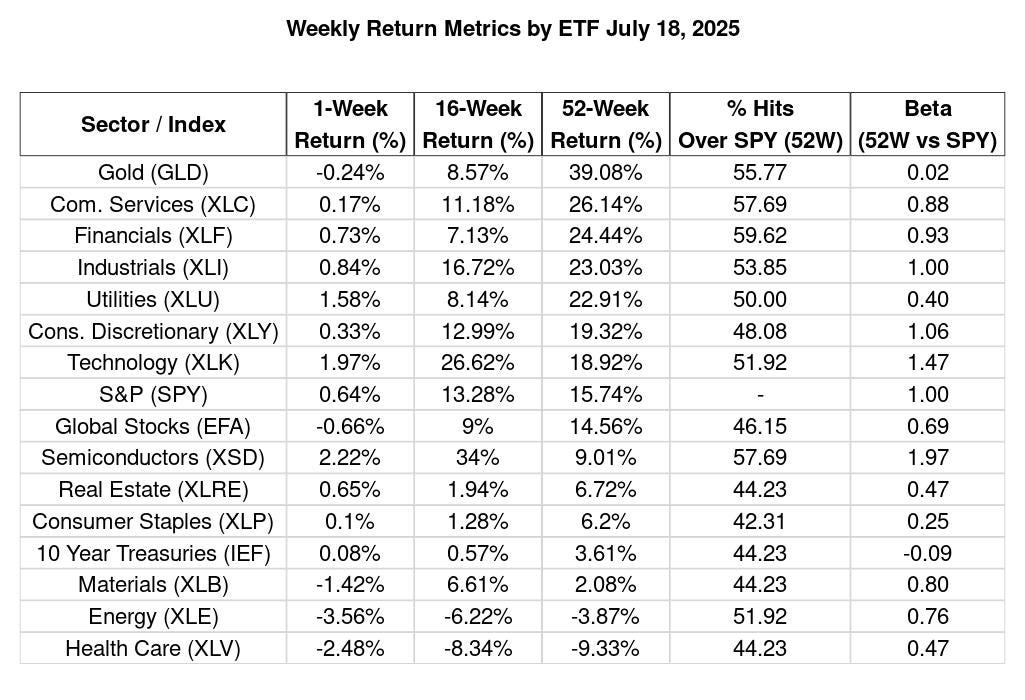
Gold still leads with a +39.08% 52-week return and a robust 1.82 Sharpe, beating SPY 56% of the time. Communication Services and Financials round out the top three, each with consistent hit rates near 60%.
Industrials and Utilities remain in the upper tier, with Utilities climbing on strong one-week momentum (+1.58%) and the highest defensive Sharpe on the board (1.22). At the bottom, Health Care collapsed further to −9.33%, with Energy and Materials also slipping.
Modeled vs. Actual Returns: Last Week’s Stratum Index
The whole point of trading once a week—and using diversified ETFs that offset each other—is so I don’t have to watch the market every day.
But I still check it constantly. I catch myself wanting to intervene, especially when things get noisy. Earlier this week, Utilities was all over the place, it was down until Friday. Yet on Friday morning, it gained ~1.6% in one day. But that’s the trap: thinking I know better than the system I built to protect me from exactly that impulse. So I remind myself—trust the model. Let it breathe.
The Stratum Index fell −0.153%, trailing SPY’s +0.635% gain and Q72’s +0.33% lift.
Utilities and Gold continued to anchor the portfolio—defensive by design. Utilities outperformed SPY, but so did Technology and Semiconductors. Not exactly a common phenomenon. When offense and defense rally together, it’s usually a sign of regime tension.
👉Learn about the Stratum Index »

Note: The results shown in this newsletter reflect real trades executed by Q72 based on Stratum Index allocations. Individual results may vary with execution, fees, and capital allocation. Past performance is not indicative of future results.
What We’re Buying Next Week at Quanta 72
In backtests, the Stratum Index has returned 61% per year. Below are the latest allocations for the week ahead.
Stratum enters the final full week of July with a defensive posture beneath a flexible structure—steady, watchful, and not in a rush to impress.
Keep reading with a 7-day free trial
Subscribe to Quanta 72 to keep reading this post and get 7 days of free access to the full post archives.