
What Actually Predicts Stock Outperformance?
A 15-year, point-in-time test finds that profitability, momentum, and market participation carried more predictive power than earnings and free cash flow alone.

What if Wall Street has been measuring the wrong fundamentals?
I let machine learning decide what actually predicts individual stock returns.
In a previous post, I compared the dot-com boom with today’s AI boom. I wanted to know whether free cash flow and earnings explained the spectacular rise, and collapse, of technology stocks.
They didn’t.
At least, not consistently enough to predict future returns.
That raised a more interesting question:
If earnings and free cash flow aren’t the best predictors of stock performance, what is?
We already know momentum works. Decades of academic research, and my own work, have shown that stocks with strong recent price performance often continue outperforming over intermediate time horizons.
But what about everything else?
Investors like Benjamin Graham and Warren Buffett built their careers around fundamental analysis. Researchers have since proposed hundreds of financial ratios, but most studies evaluate one or two factors at a time. Markets don’t work that way. Companies are simultaneously growing, borrowing, generating cash, and competing for capital.
Machine learning offered a different approach.
Instead of asking whether one ratio works, I asked a model to evaluate them all at once. I trained it using more than 15 years of point-in-time financial statements from historical S&P 500 companies and tested whether it could predict which stocks would outperform the market over the following year.
The results weren’t what I expected.
The Test
I intentionally kept the methodology simple.
I downloaded standardized financials and market data for 8,021 U.S. companies. The dataset included income statements, balance sheets, cash flow statements, and historical price data.
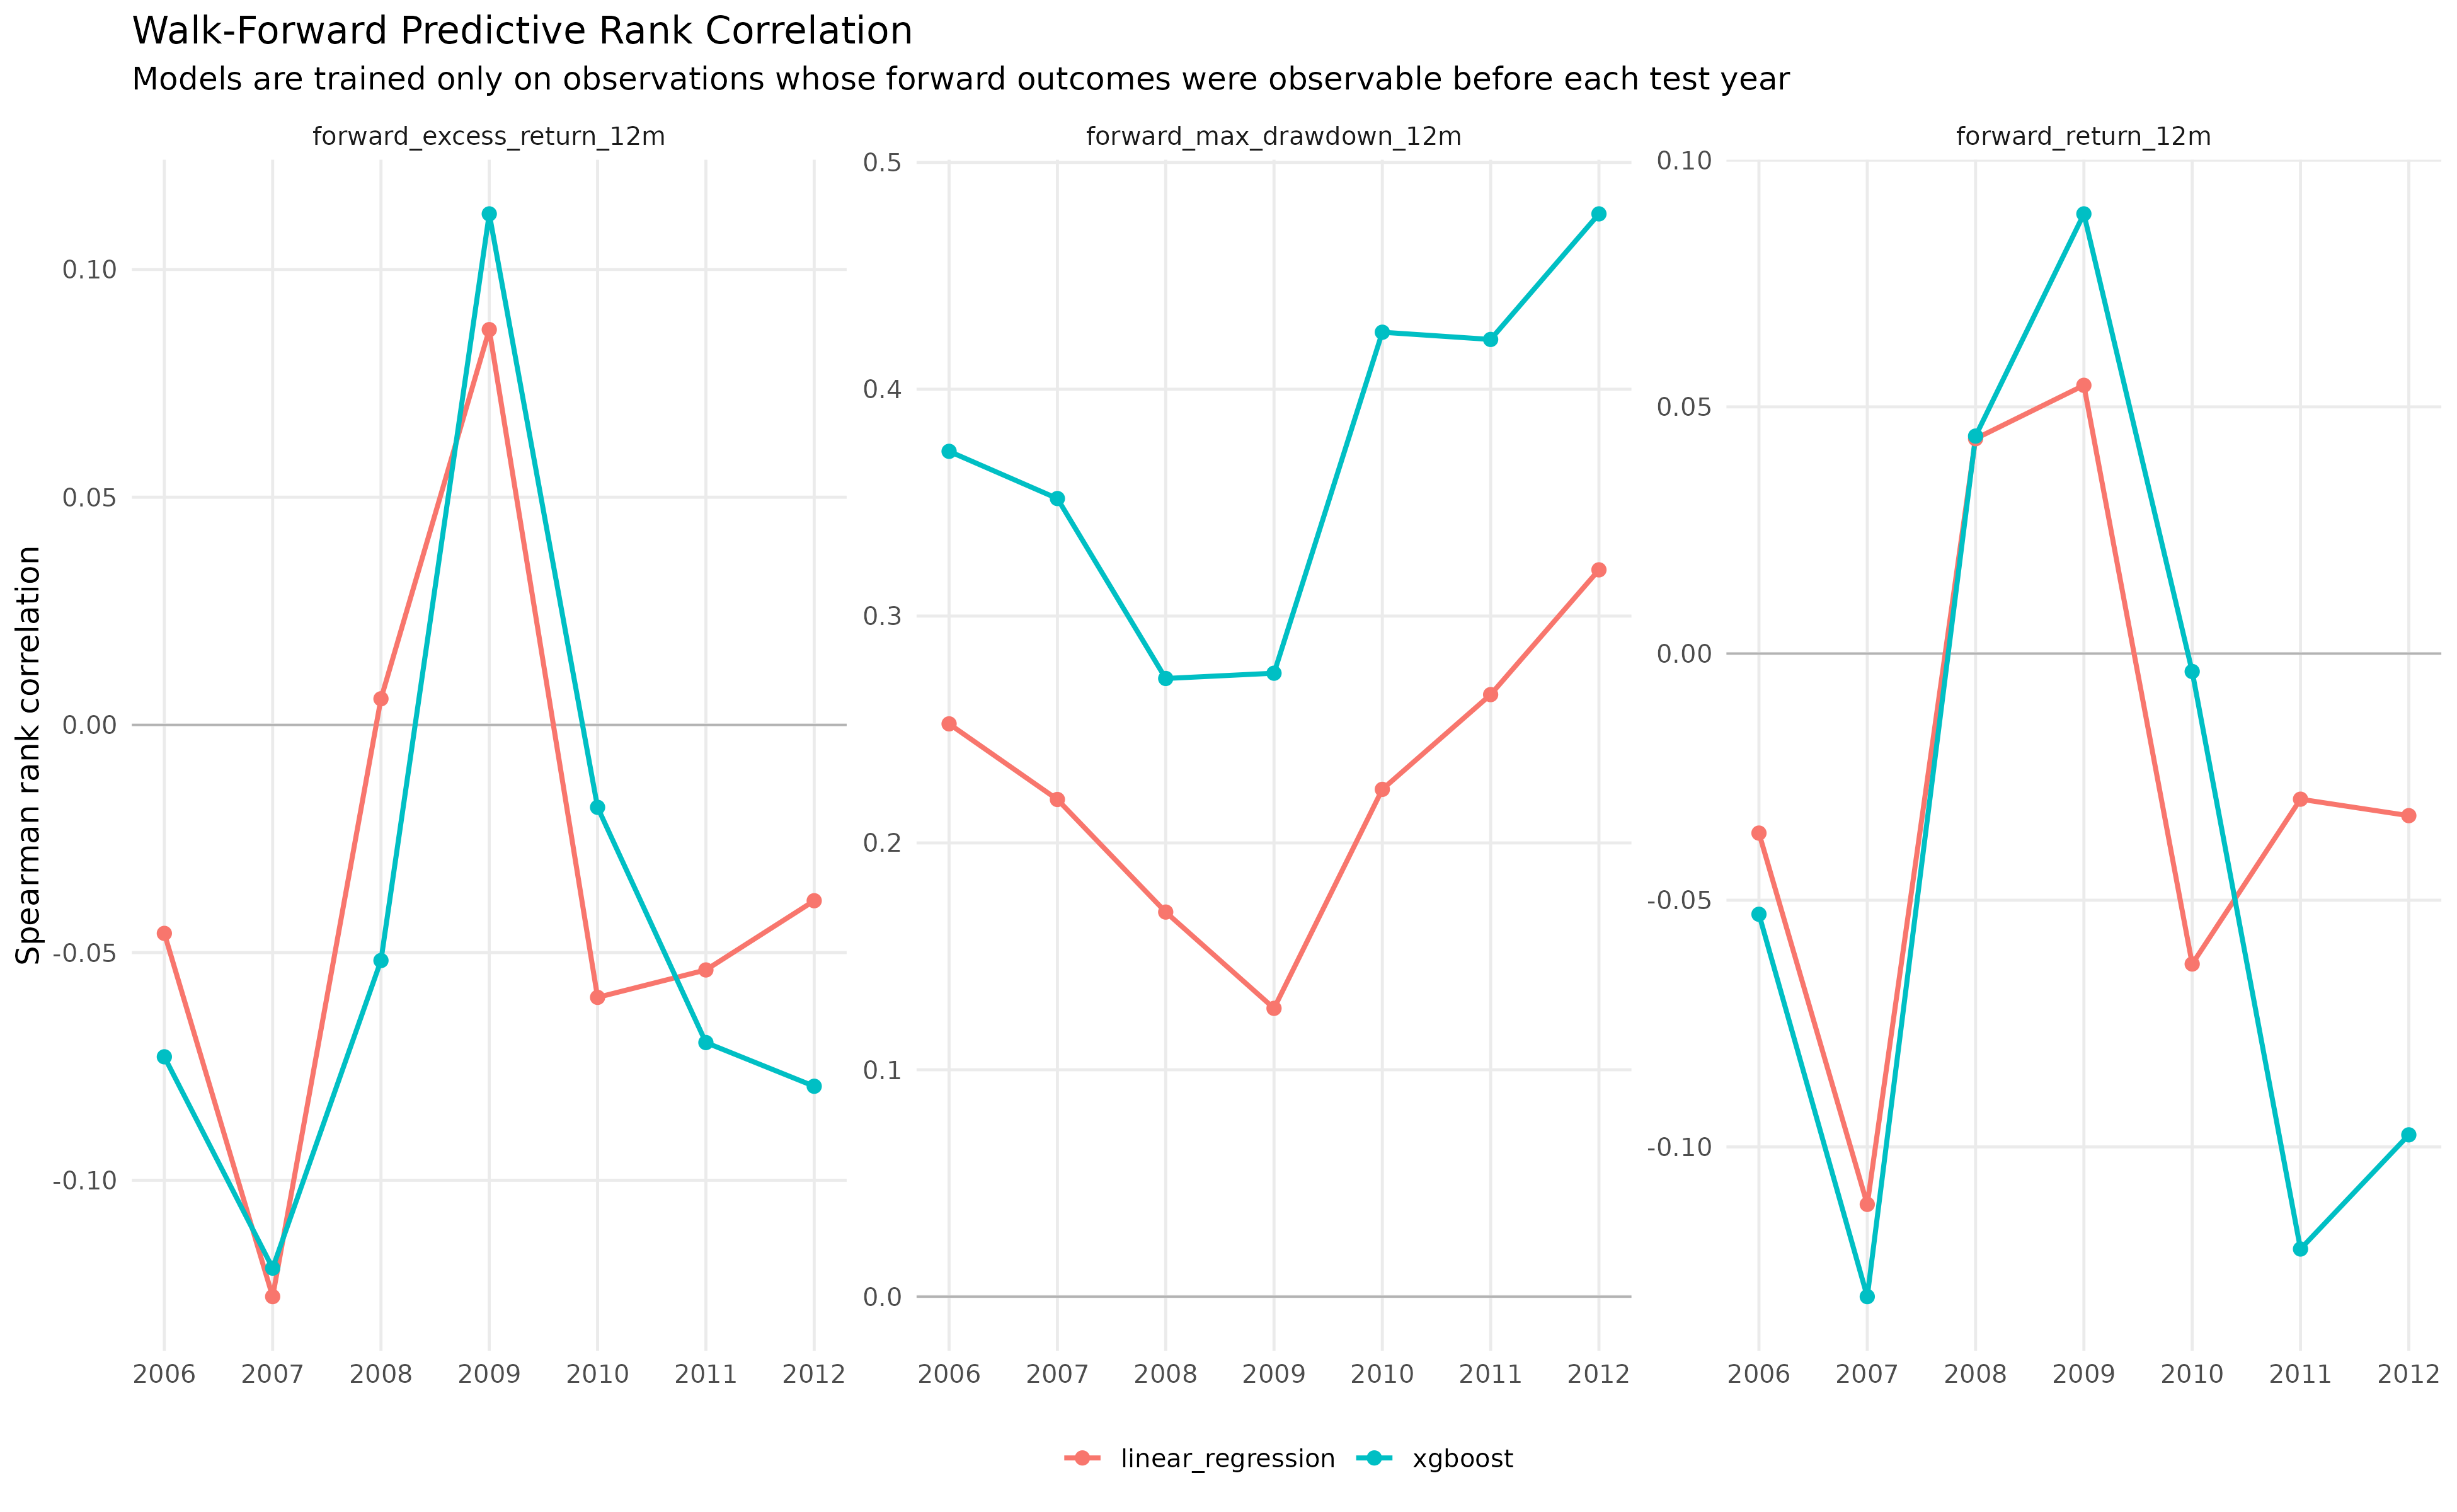
The dataset spans 1998 through 2013. Using walk-forward validation, each model was trained only on historical data available prior to the test year. For example, the 2006 model was trained on 1998–2005 data, while the 2012 model was trained on 1998–2011.
From each quarterly filing, I calculated approximately 25 financial and market factors, including revenue growth, free cash flow growth, operating margins, return on equity, leverage, liquidity, momentum, and average dollar trading volume.
The initial universe contained 8,021 companies, but the final analysis was restricted to historical S&P 500 constituents using the index membership that existed at each point in time.
For every quarterly filing, the model only saw information that would have been publicly available on that date. Each filing was matched to the next available trading day, and the model attempted to answer a single question:
Based only on the information available today, which stocks will outperform the S&P 500 over the next 12 months?
Performance was measured as 12-month forward excess return relative to SPY, rather than absolute return.
Finally, I compared two different modeling approaches:
The first was a linear regression. One of its biggest advantages is transparency. Every variable receives a coefficient, making it easy to see exactly how each factor contributes to the final prediction. In effect, the prediction is simply the weighted sum of all the inputs.
The second was XGBoost, a nonlinear machine learning model. Rather than assuming every factor has a constant effect, XGBoost can identify complex relationships between variables. It can learn, for example, that high return on equity may only be beneficial when momentum is strong, or that revenue growth matters more for companies with low leverage. Instead of relying on a single equation, it builds hundreds of decision trees that capture these interactions.
The objective wasn’t to build the world’s best trading algorithm. It was much simpler:
Which financial characteristics consistently contained predictive information once every other variable was considered at the same time?
Which Factors Consistently Predicted Outperformance?
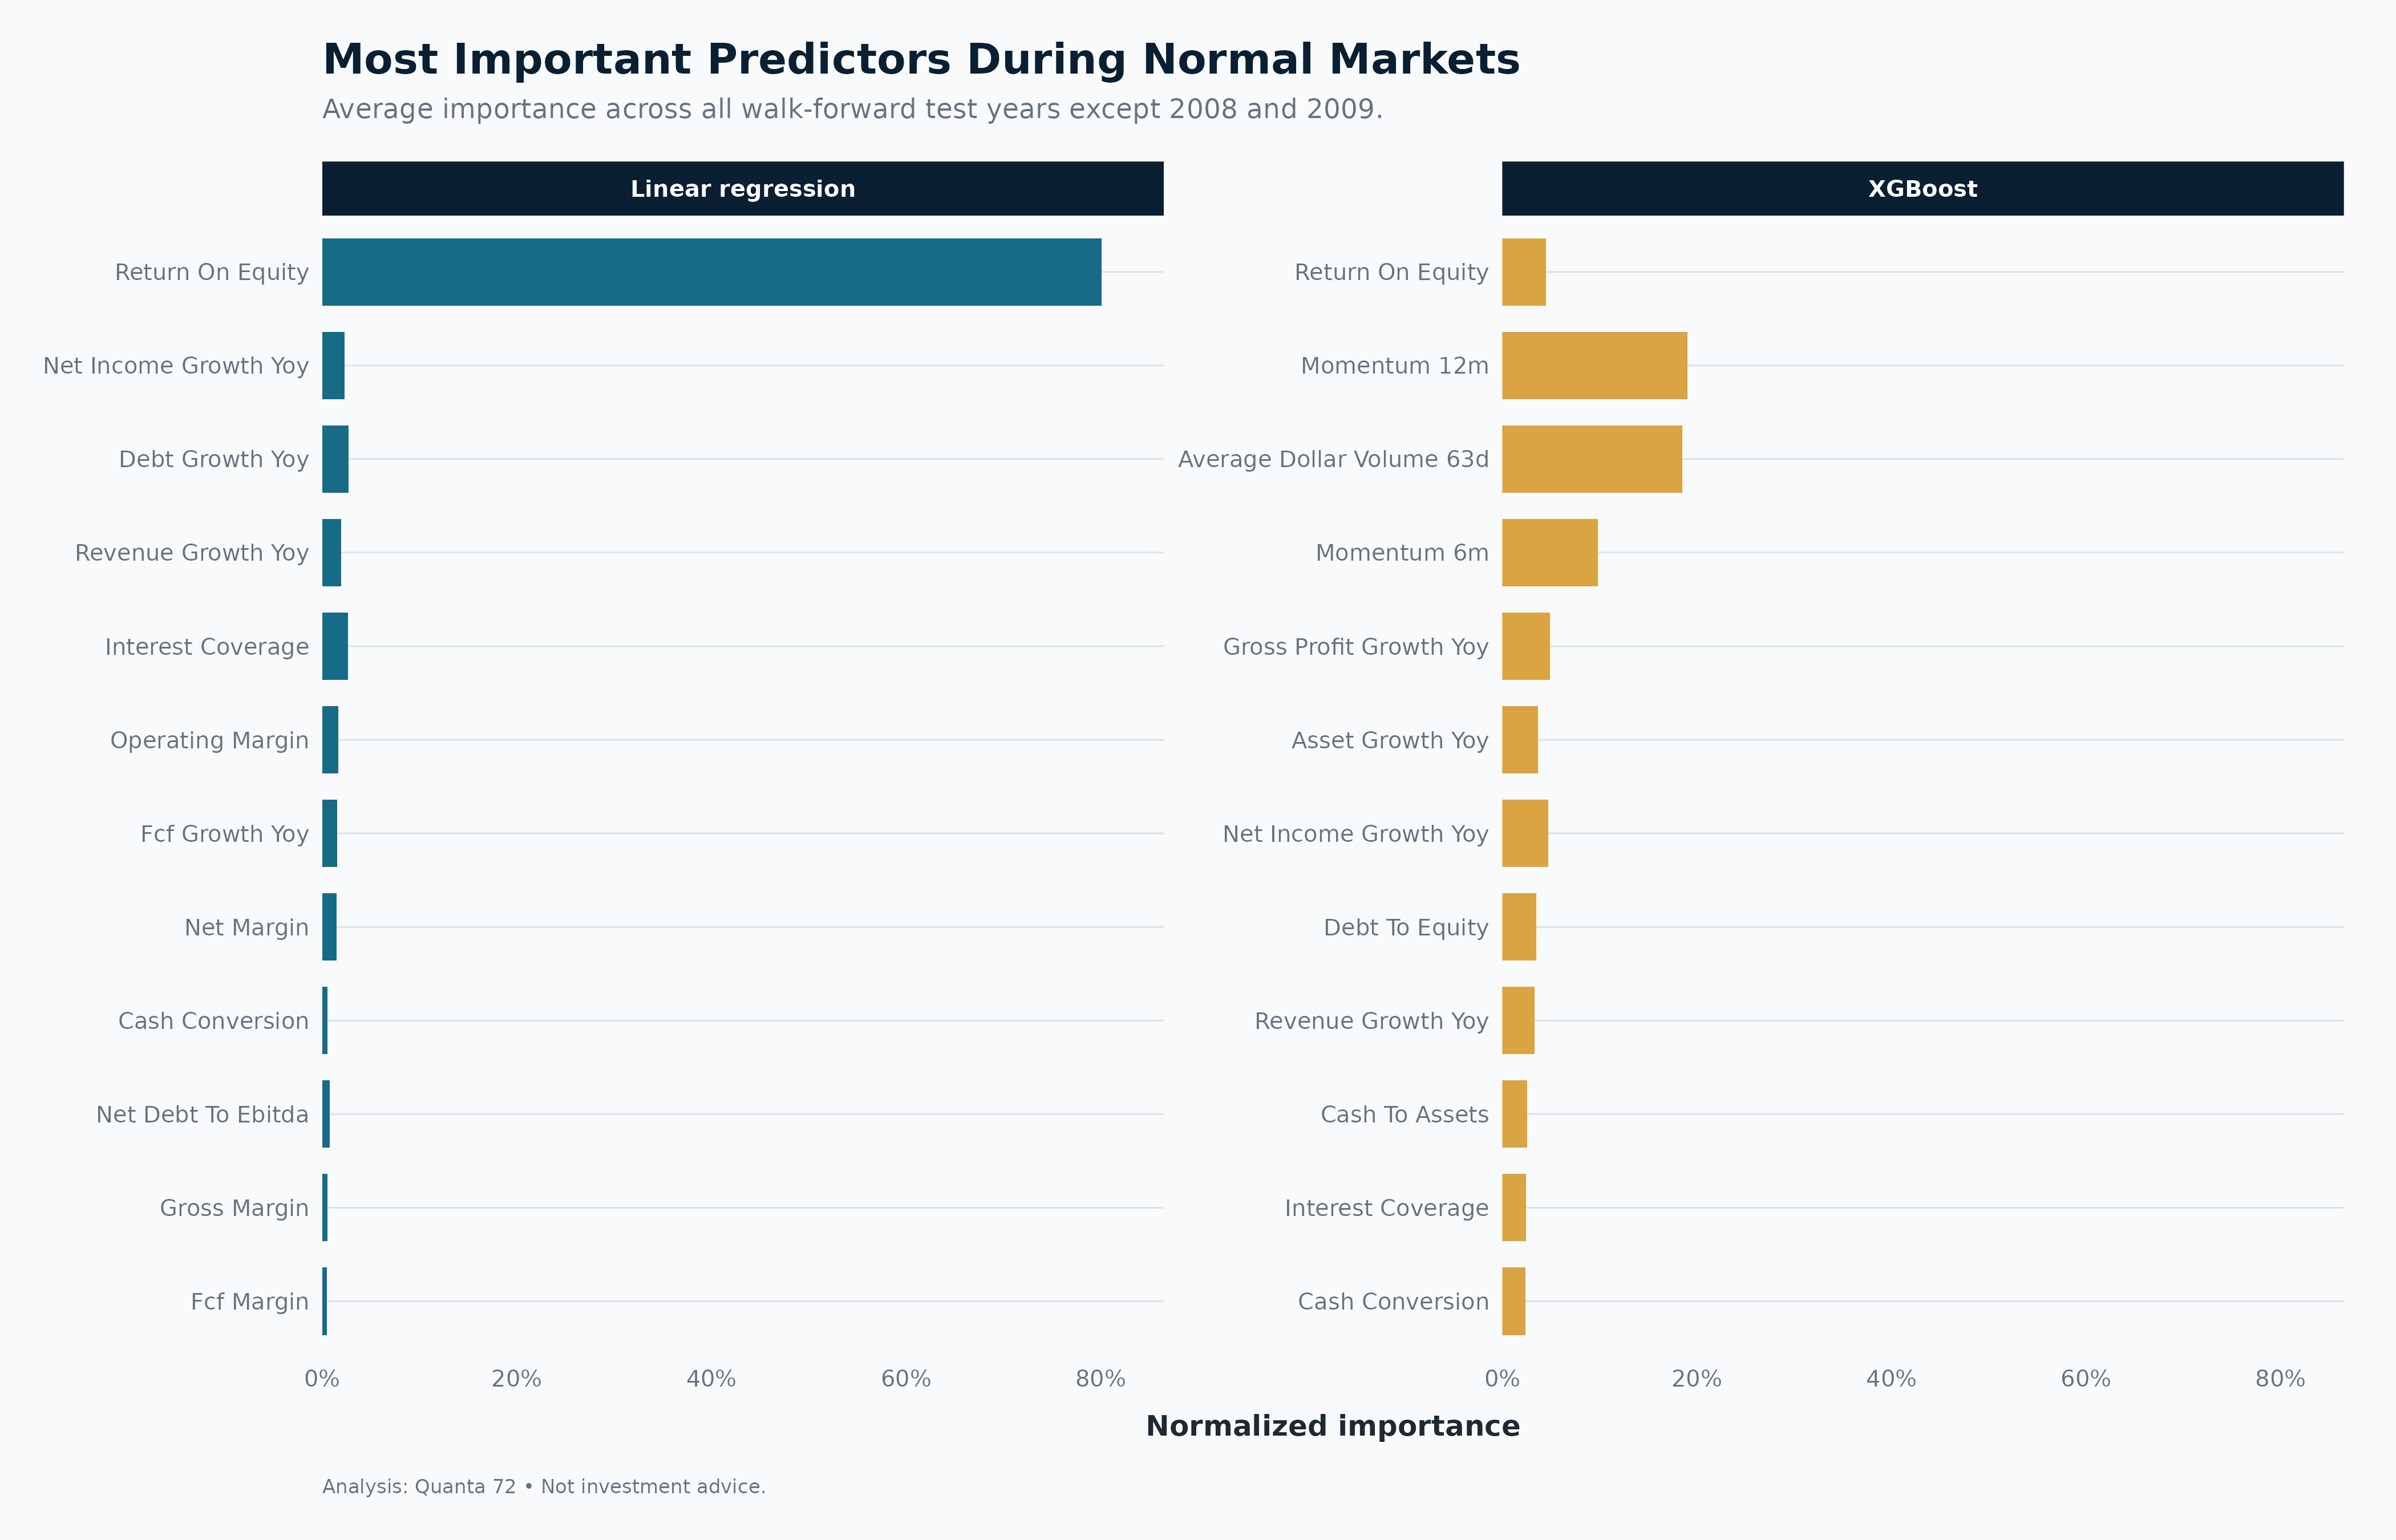
A traditional linear regression model suggests that return on equity (ROE) is by far the most important fundamental factor for selecting individual stocks within the S&P 500.
This result is striking because ROE has long been one of the cornerstone metrics of value investing. In this 15-year sample, it accounted for nearly 80% of the regression model’s total explanatory importance, dwarfing every other fundamental combined.
XGBoost, which identifies patterns by building hundreds of decision trees, also ranked return on equity (ROE) as one of the most important factors. Unlike the linear regression, however, it found that no single variable dominated. Instead, ROE, 12-month momentum, 6-month momentum, and average 63-day dollar volume emerged as the strongest contributors, suggesting that future outperformance depends on a combination of profitability, momentum, and liquidity rather than any single fundamental metric.
How the Factors Relate to One Another
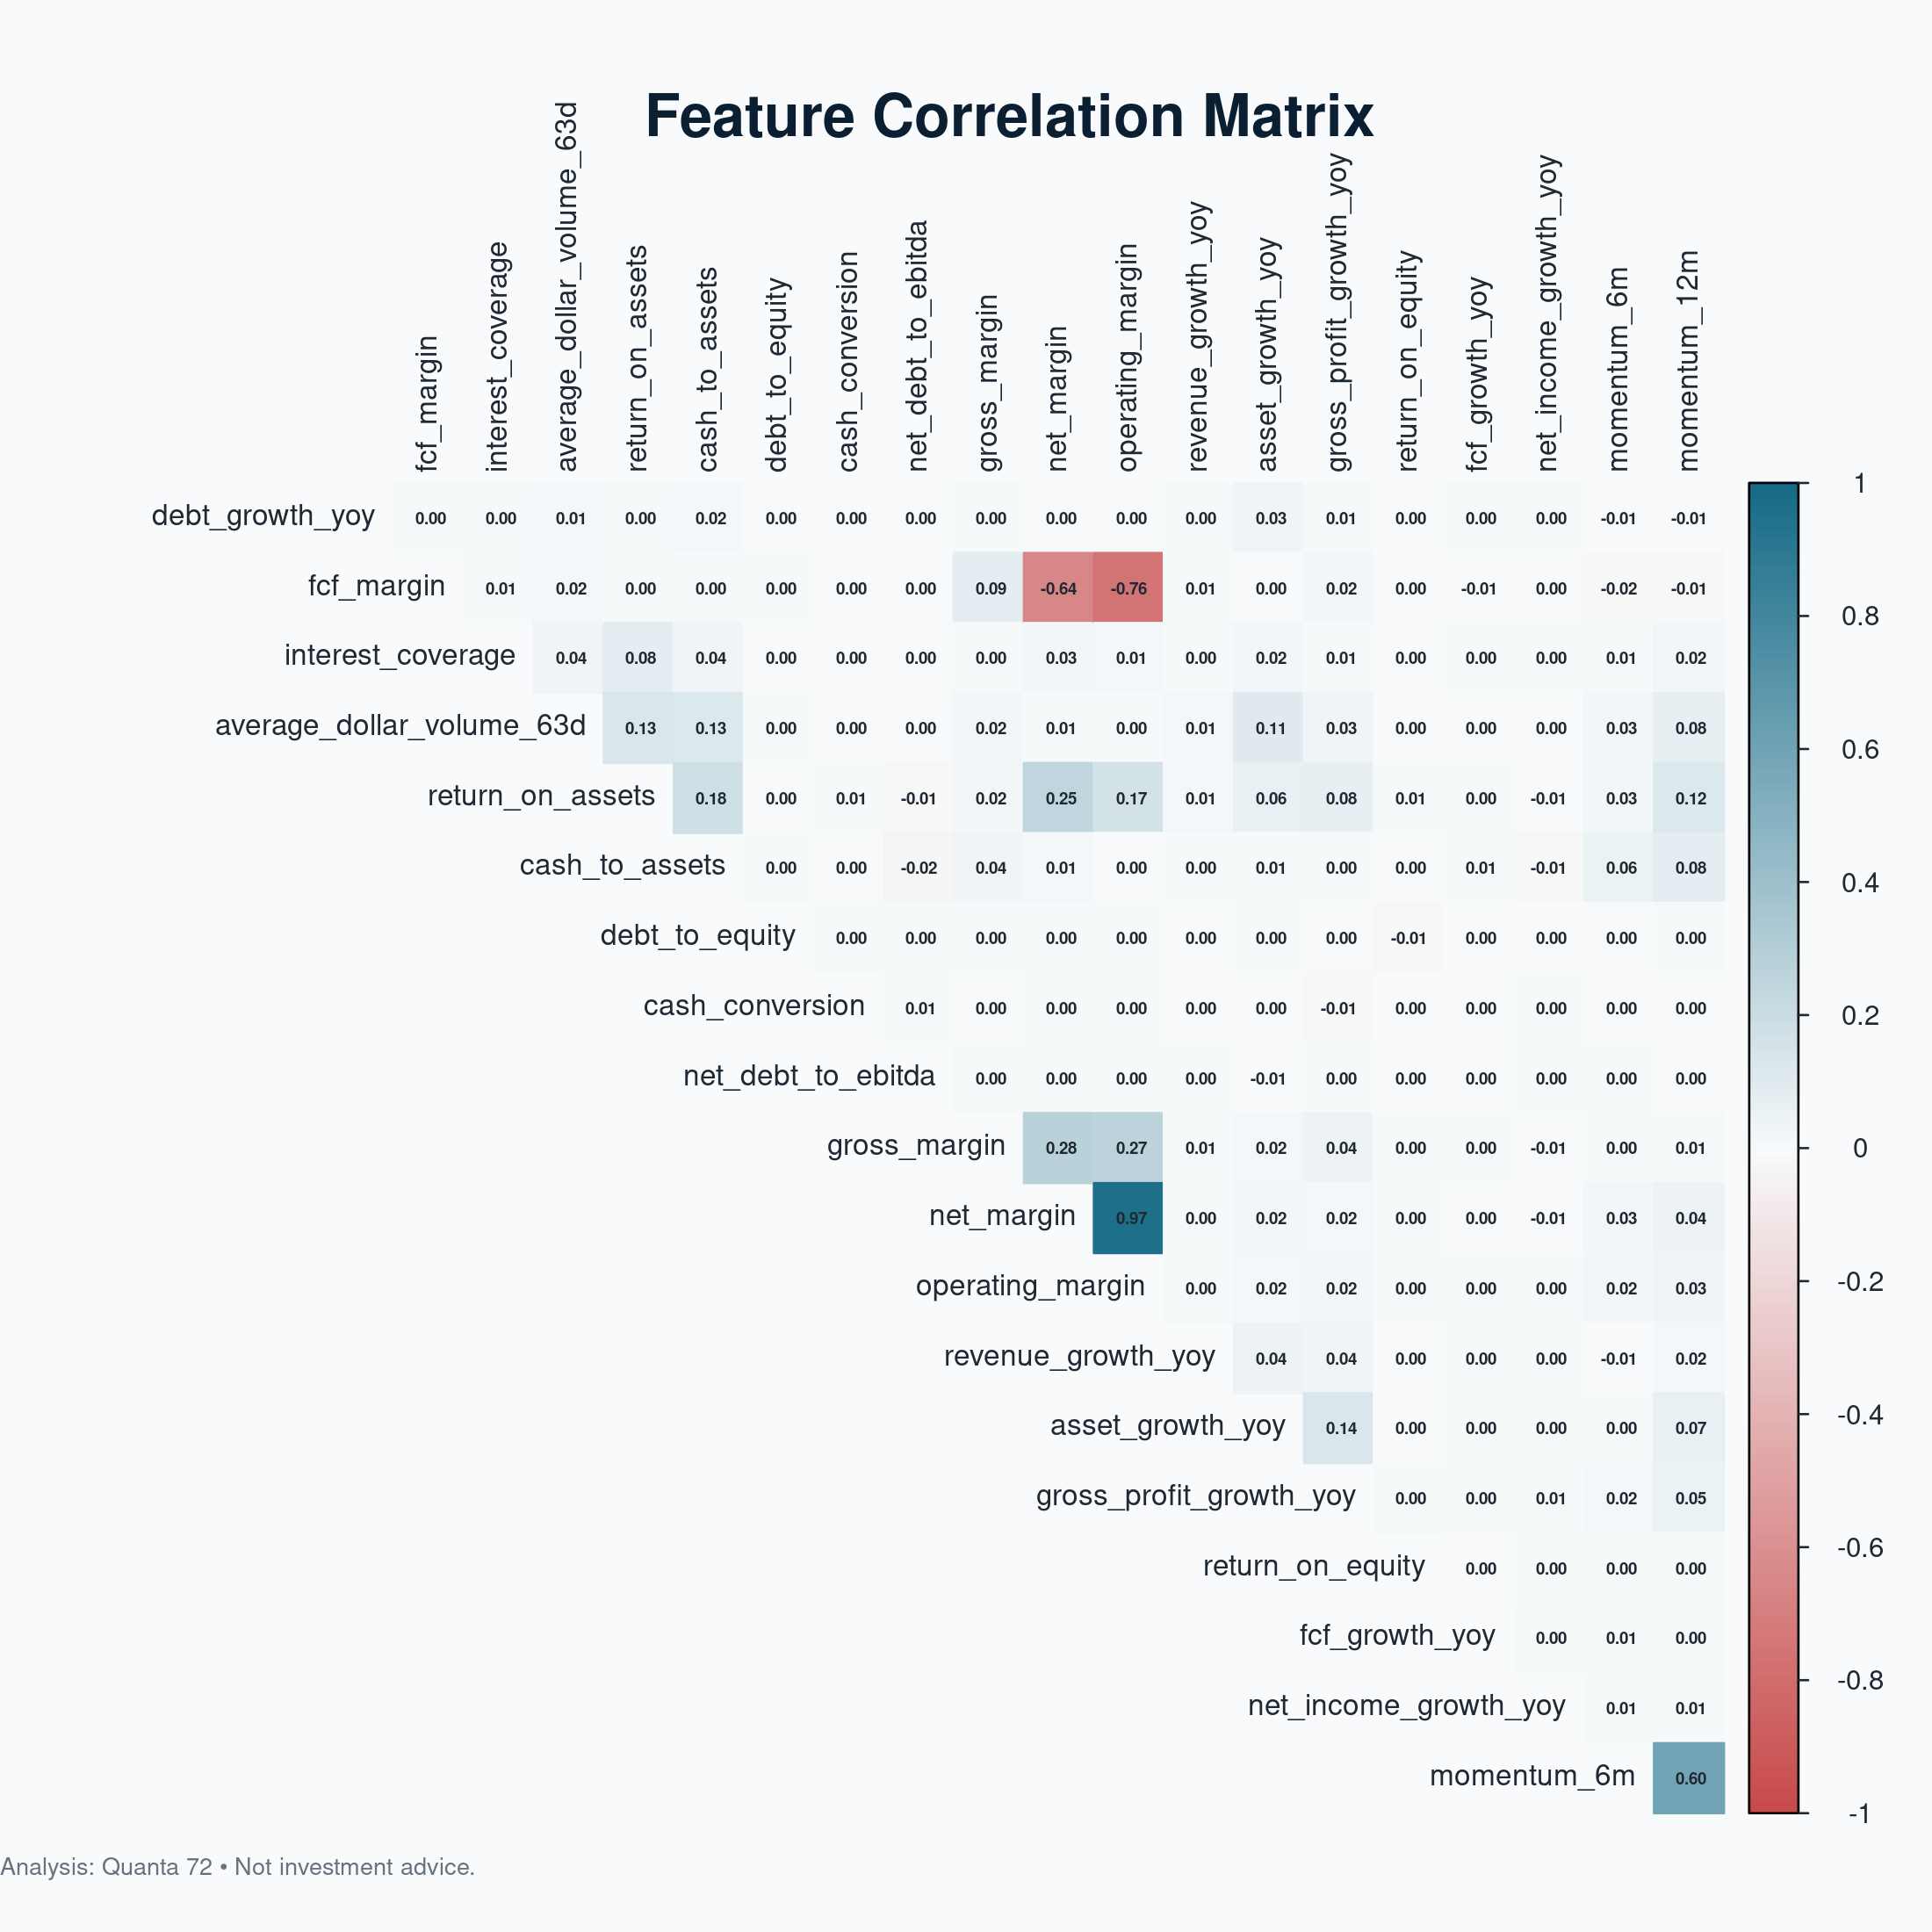
One concern with any machine learning model is that it may assign high importance to a variable simply because it overlaps with other inputs. The correlation matrix suggests that is not the case here. While a handful of profitability metrics, such as operating margin and net margin, are highly correlated, return on equity (ROE) exhibits relatively weak relationships with most of the other variables, including momentum, growth, leverage, and liquidity.
This makes ROE’s dominance in the linear regression more meaningful. Rather than acting as a substitute for several highly correlated metrics, ROE appears to capture information about future stock performance that is largely unique. At the same time, the correlation matrix helps explain why XGBoost distributed importance across multiple variables. Because most of the factors measure different aspects of a business, the nonlinear model was able to combine profitability, momentum, and liquidity into more nuanced decision rules than a single linear equation could capture.
Crisis Years 08 and 09
Many people ask what mattered during the 2008–2009 financial crisis. I expected the results to look dramatically different from the normal market analysis, but they didn’t. The same fundamental factors continued to rank near the top, with only modest changes in their ordering. In other words, the characteristics that identified stocks that outperformed SPY in normal markets were largely the same during one of the worst bear markets in history.
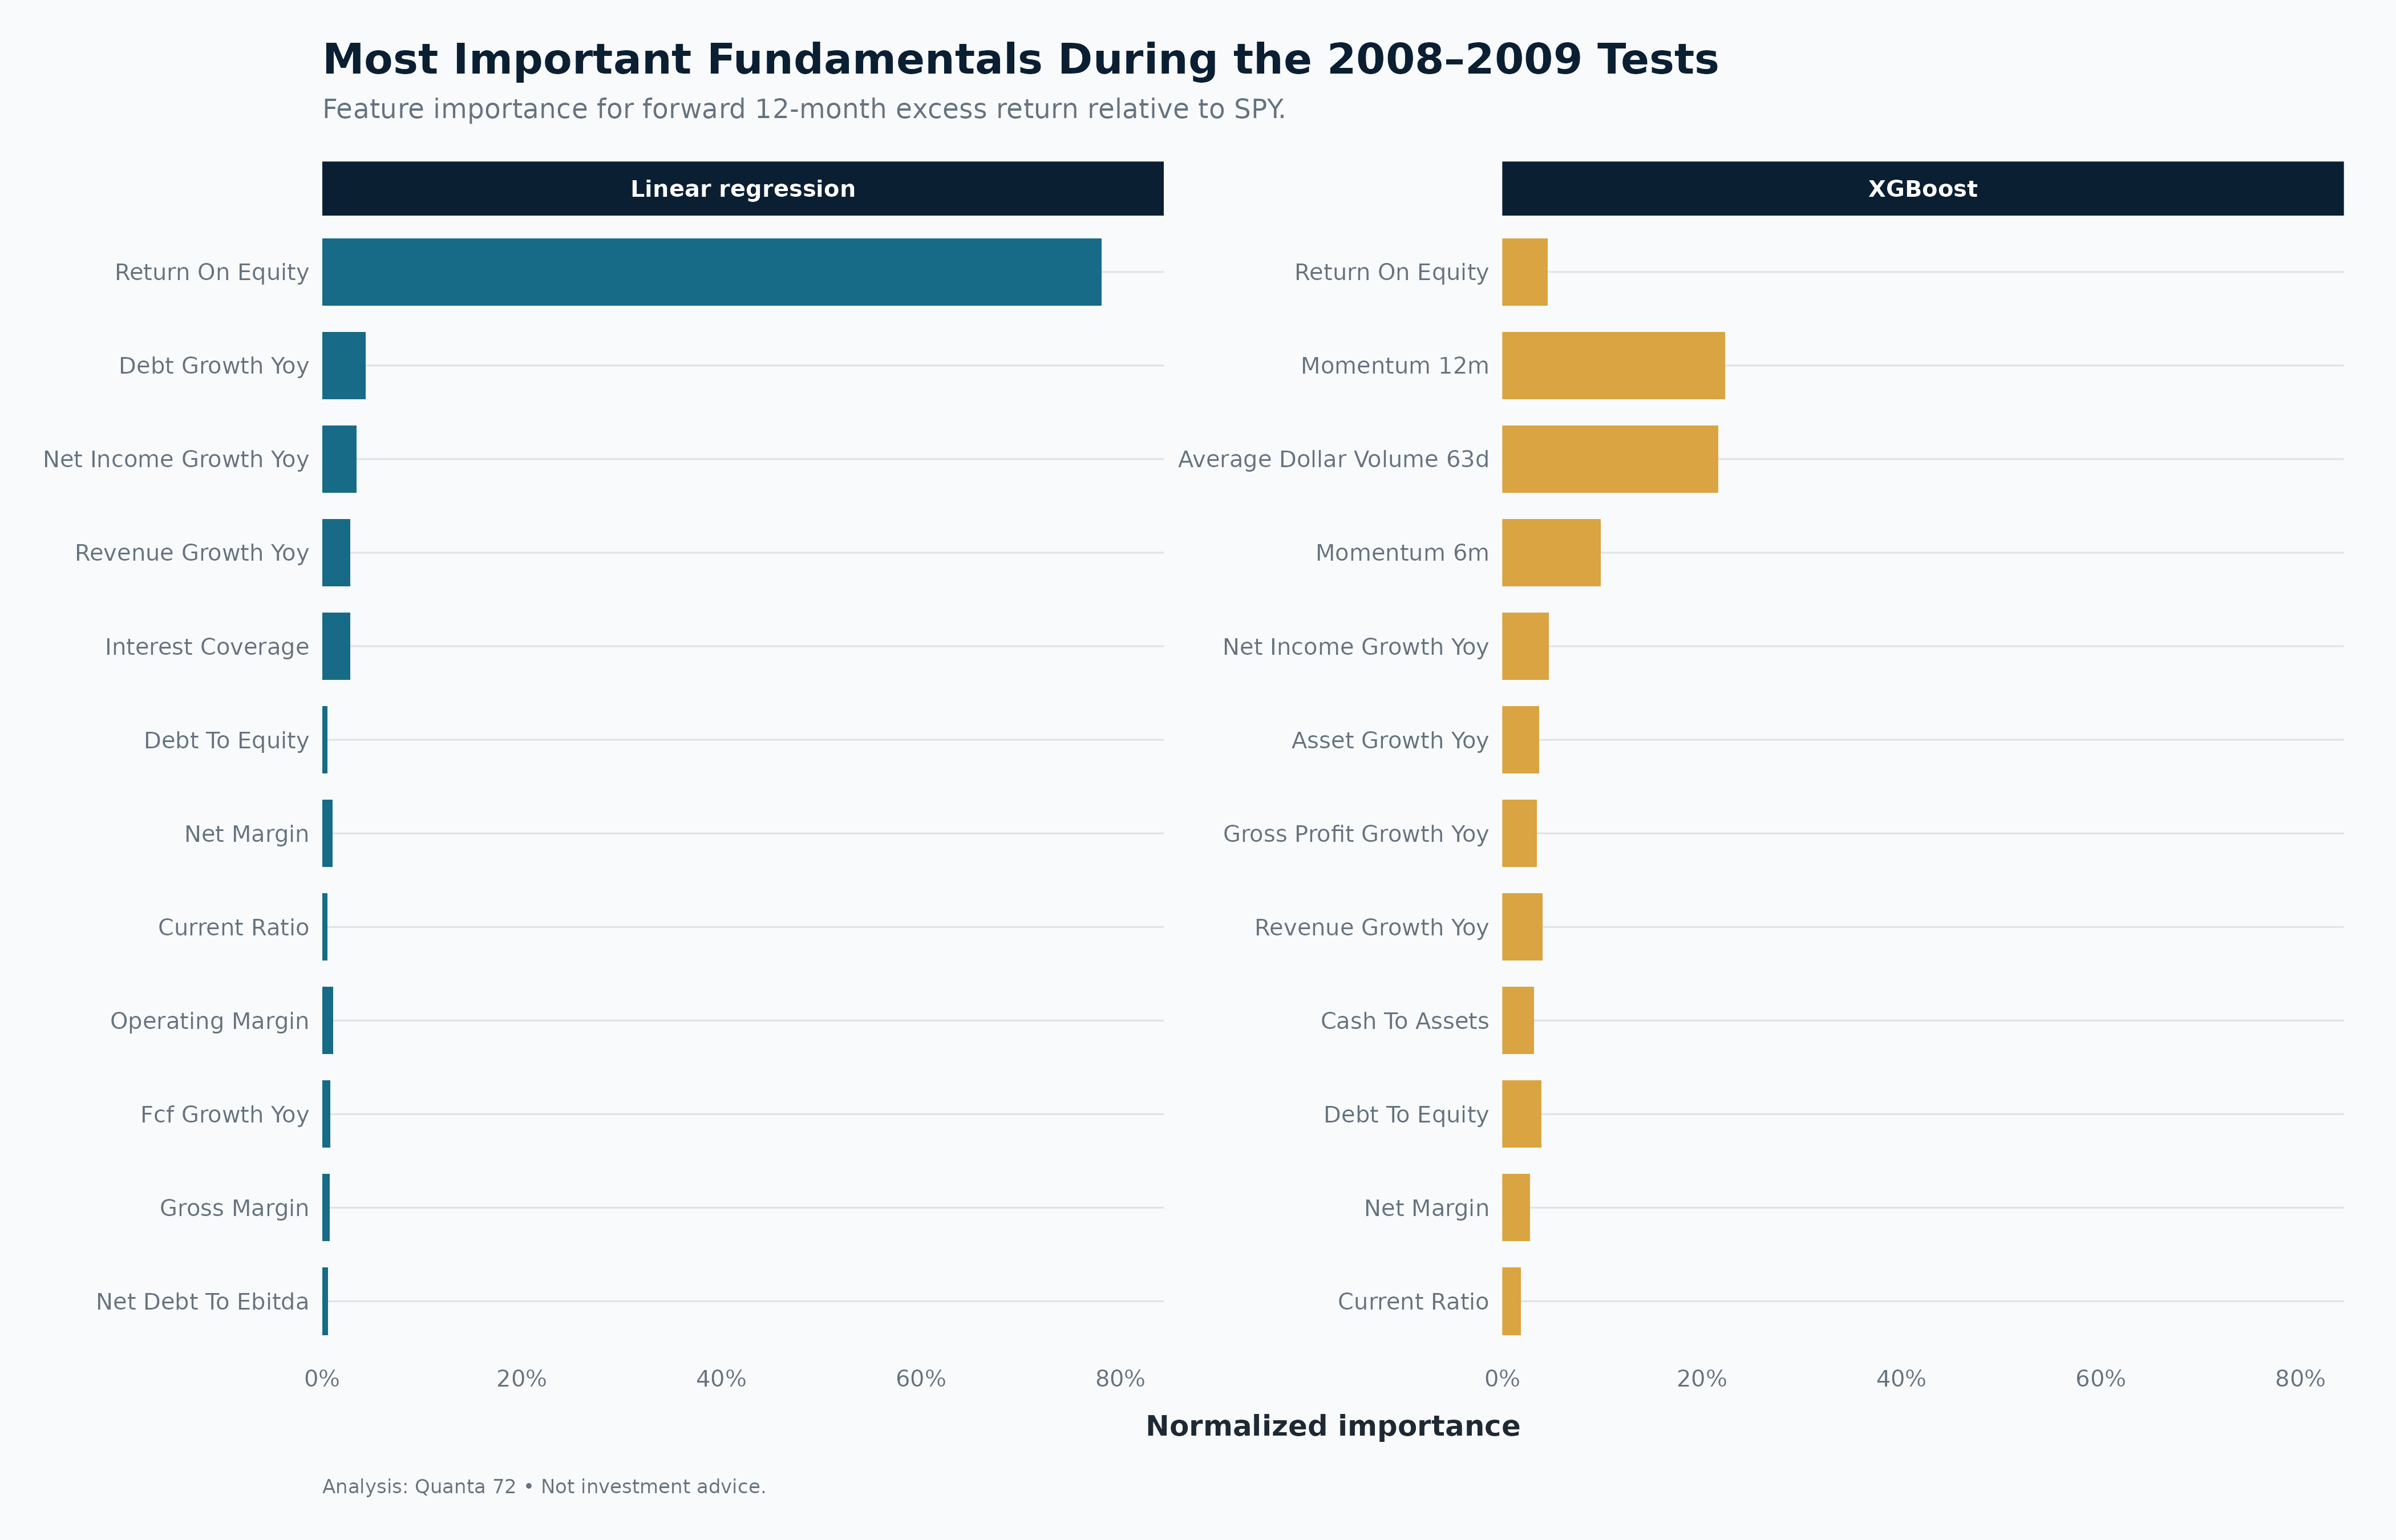
Across both normal markets and the financial crisis, one feature consistently ranked near the top: Average 63-Day Dollar Volume. Calculated as shares traded multiplied by share price, it measures the dollar value of stock changing hands each day. While often described as a measure of liquidity, it is perhaps better thought of as a measure of market cap. A small-cap stock can trade millions of shares yet still have relatively little capital changing hands if its share price is low. Dollar volume x share volume captures where investors are actually committing meaningful amounts of capital.
From Research to Portfolio Construction
The goal of this research was to answer a practical question: Which fundamental factors deserve the most weight for individual stock selection?
Before running this analysis, I was already leaning toward emphasizing return on equity (ROE) and price momentum. The results strengthened that conviction. Across linear regression, XGBoost, normal markets, and the financial crisis, these two factors consistently ranked among the strongest predictors of future outperformance.
Perhaps the most important takeaway is that neither fundamentals nor price action told the full story on their own.
Rotation, structure, and behavioral signals are our edge in a market gripped by reflex.
📉 2018 Volmageddon — Shifted into bonds and gold
🦠 2020 COVID Crash — Early defense
🏦 2022 Rate Cycle — Avoided tech collapse
🔁 2024 Reflation — Led SPY back into offense
Learn about the Stratum Index »
Appendix
Growth Metrics (Year-over-Year)
Revenue Growth: (Revenue TTM / Lag(4) Revenue TTM) - 1
Gross Profit Growth: (Gross Profit TTM / Lag(4) Gross Profit TTM) - 1
Net Income Growth: (Net Income TTM / Lag(4) Net Income TTM) - 1
Operating Cash Flow Growth: (Operating Cash Flow TTM / Lag(4) Operating Cash Flow TTM) - 1
Free Cash Flow (FCF) Growth: (FCF TTM / Lag(4) FCF TTM) - 1
Note: FCF is defined in the script as Operating Cash Flow + CapEx.
Asset Growth: (Total Assets / Lag(4) Total Assets) - 1
Debt Growth: (Total Debt / Lag(4) Total Debt) - 1
Margins
Gross Margin: Gross Profit TTM / Revenue TTM
Operating Margin: Operating Income TTM / Revenue TTM
Net Margin: Net Income TTM / Revenue TTM
FCF Margin: FCF TTM / Revenue TTM
Returns & Efficiency
Return on Assets (ROA): Net Income TTM / Average of (Current Assets + Lag(4) Assets)
Return on Equity (ROE): Net Income TTM / Average of (Current Equity + Lag(4) Equity)
Cash Conversion: Operating Cash Flow TTM / Net Income TTM
Accruals to Assets: (Net Income TTM - Operating Cash Flow TTM) / Total Assets
Leverage & Liquidity
Debt to Assets: Total Debt / Total Assets
Debt to Equity: Total Debt / Total Equity
Cash to Assets: Cash & Equivalents / Total Assets
Working Capital to Assets: Working Capital / Total Assets
Current Ratio: Current Assets / Current Liabilities
Interest Coverage: EBIT TTM / Absolute Value of Interest Expense TTM
Net Debt to EBITDA: (Total Debt - Cash & Equivalents) / EBITDA TTM
Price & Volume
6-Month Momentum: (Current Adjusted Close / Adjusted Close 126 trading days ago) - 1
12-Month Momentum: (Current Adjusted Close / Adjusted Close 252 trading days ago) - 1
Average Dollar Volume (63-day): The 63-trading-day rolling average of (Adjusted Close × Daily Share Volume)
Disclaimer: This material is for informational and educational purposes only and does not constitute investment advice. Past performance does not guarantee future results. All strategies involve risk, including the potential loss of principal. Always conduct your own research or consult a qualified financial professional before making investment decisions.
The goal. Understanding what drives stock performance and how to apply it is why your words are superior.
Jeff
I love this kind of data driven investigation and double love it when one explains it clearly and concisely as you did in this post. Hate reading long white papers on such work Thanks!!